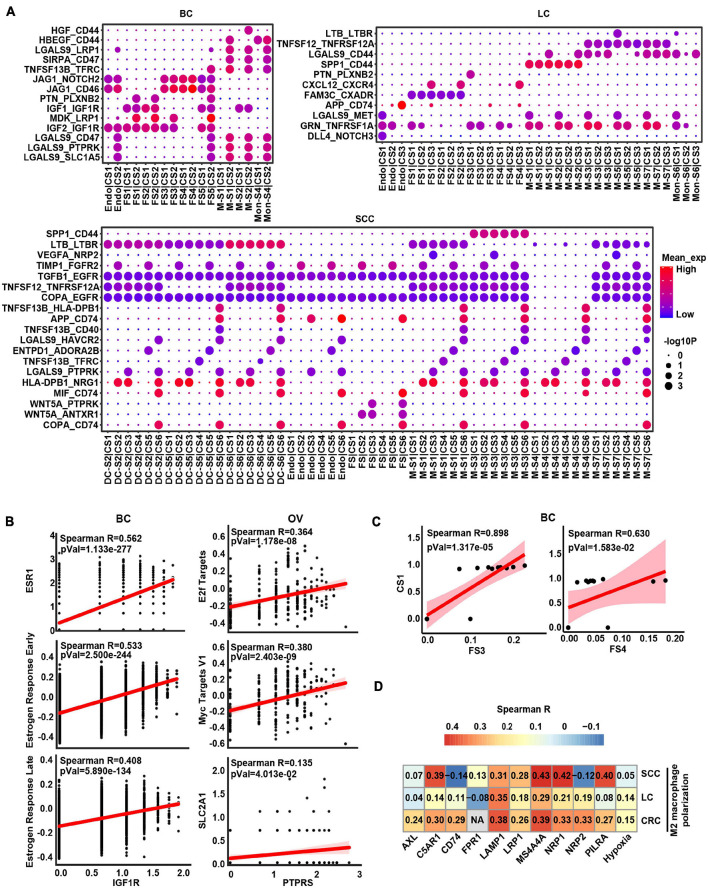
FIGURE 4.
The intercellular interactions between non-malignant cells and cancer cells. (A) Significant ligand–receptor genes accounting for specific intercellular interactions in BC, LC, and SCC. P-values are indicated by circle size. The means of the average expression level of interacting molecule (ligand or receptor genes) 1 in cluster 1 and interacting molecule 2 in cluster 2 are indicated by color. Subclusters 0, 1, 2, 3, and 4 of stroma cells were labeled FS1, FS2, FS3, FS4, and FS5 in each cancer type. Subclusters 0, 1, 2, 3, and 4 of cancer cells were labeled CS1, CS2, CS3, CS4, and CS5 in each cancer type. Subclusters 0, 1, 2, 3, and 4 of macrophages/monocytes/dendritic cells were labeled M-S1/Mon-S1/DC-S1, M-S2/Mon-S2/DC-S2, M-S3/Mon-S3/DC-S3, M-S4/Mon-S4/DC-S4, and M-S5/Mon-S5/DC-S5 in each cancer type. Endo is endothelial cells. (B) Correlation scatter plot between main receptors expressed on cancer cells and specific pathways as well as genes in BC and OV. (C) Correlation between proportional changes in specific stromal cell cluster and cancer cell cluster in BC. (D) Heatmap depicts the correlations between M2 macrophage polarization and hypoxia as well as main receptors expressed on macrophage.

