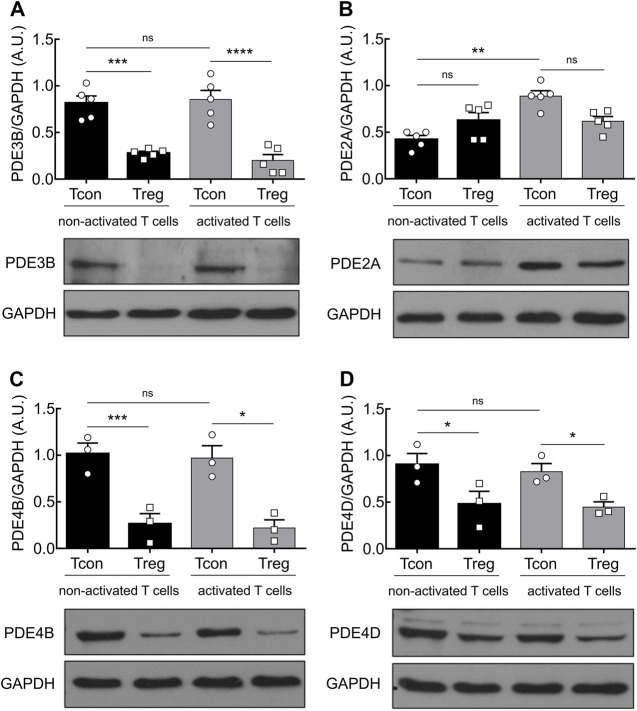
FIGURE 1.
PDE2A is upregulated in Tcon upon TCR engagement. Magnetically isolated T cell subsets were cultured for 24 h in the presence or absence of anti-CD3/CD28 Dynabeads. Representative immunoblots show protein expression and quantification of (A) PDE3B, (B) PDE2A, (C) PDE4B, and (D) PDE4D. GAPDH was used as a loading control. Results in bar graphs are presented as mean ± SEM from three to five independent experiments. A.U.–arbitrary unit. *p < 0.05, **p < 0.01, ***p < 0.001, ****p < 0.0001, ns–not significant by one-way ANOVA followed by Sidak’s multiple comparison test.

