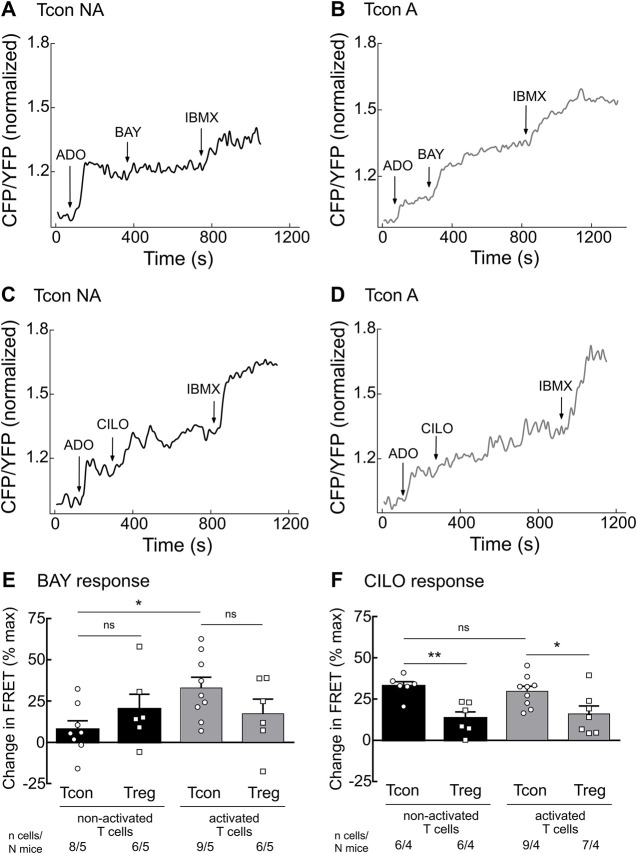
FIGURE 2.
Live-cell imaging of PDE2 and PDE3 inhibitor effects in the cytosol of non-activated (NA) and activated (A) T cells. Murine Tcon and Treg isolated from CAG-Epac1-camps mice were cultured for 16–24 h in the presence or absence of anti-CD3/CD28 Dynabeads and used for FRET based live-cell recordings. Representative traces from FRET measurements for (A) non-activated and (B) activated Tcon upon PDE2A inhibition by BAY (100 nM) and (C) non-activated and (D) activated Tcon upon PDE3B inhibition by CILO (10 µM) are shown. T cells were first prestimulated with adenosine (ADO, 10 µM) to induce cAMP production. (E,F) Quantification of FRET responses shown in A-D, together with Treg responses, upon stimulation with (E) BAY or (F) CILO of individual cells measured are presented as percent of maximal FRET biosensor response generated by IBMX (100 µM). Decrease in cAMP level is shown as a negative value. Results are depicted as mean ± SEM. Cell number (n) and total number of mice (N) per group are indicated below the bars. *p < 0.05, **p < 0.01, ns–not significant by one-way ANOVA followed by Sidak’s multiple comparison test.

