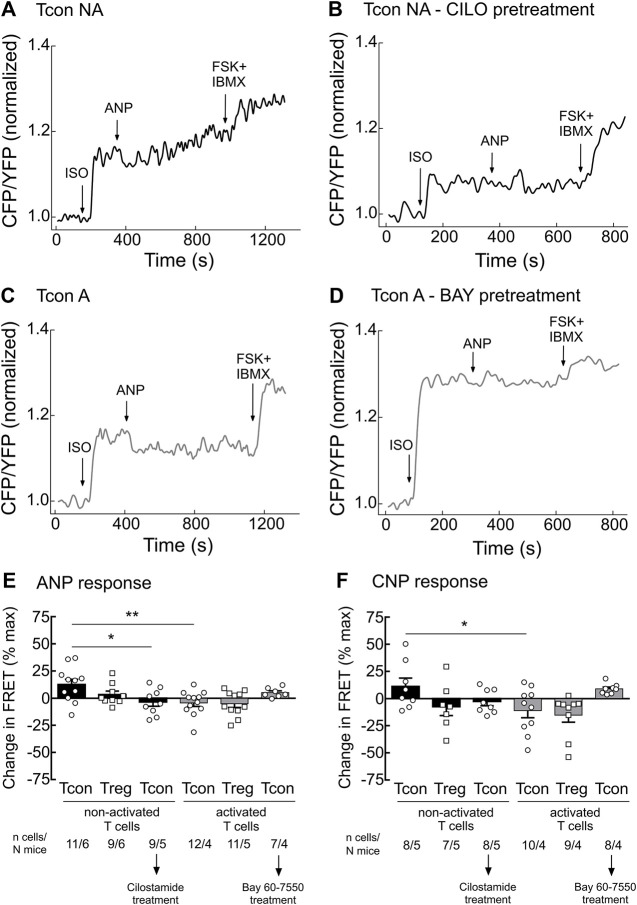
FIGURE 3.
Tcon activation changes cGMP/cAMP cross-talk in response to NP. Primary Tcon and Treg were MACS-purified and cultured for 16–24 h in the presence or absence of anti-CD3/CD28 Dynabeads following FRET measurements. Representative FRET traces from Tcon expressing Epac1-camps sensor in (A) non-activated (NA), (B) non-activated T cells after CILO pretreatment (10 µM), (C) activated, and (D) activated T cells after BAY pretreatment (100 nM). T cells were initially stimulated with the non-selective β-AR agonist isoprenaline (ISO, 1 µM), to induce cAMP production. Change in FRET represents a cAMP response to NPs (200 nM ANP or 300 nM CNP) of individual cells as a percent of maximal FRET biosensor response induced by Forskolin (FSK, 10 µM) and IBMX (100 µM). Decrease in cAMP level is depicted as a negative value. (E,F) Quantification of FRET responses shown in (A–D), together with data obtained from Treg measurements are depicted in this bar graph. Results are presented as mean ± SEM. Cell number and total number of mice measured per group are indicated below the bars. *p < 0.05; **p < 0.01; ns–not significant by one-way ANOVA followed by Sidak’s multiple comparison test.

