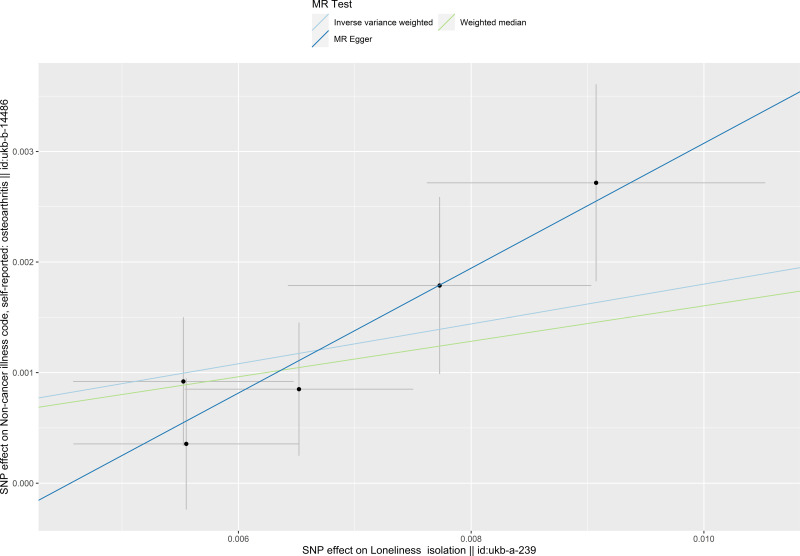
Figure 2.
Scatter plot of the causal effect of social isolation on osteoarthritis. The plot presents the effect sizes of the single nucleotide polymorphism (SNP)-social isolation association (x-axis, standard deviation units) and the SNP-osteoarthritis association (y-axis, log (odds ratio)) with 95% confidence intervals. The regression slopes of the lines correspond to causal estimates using the three Mendelian randomization methods.

