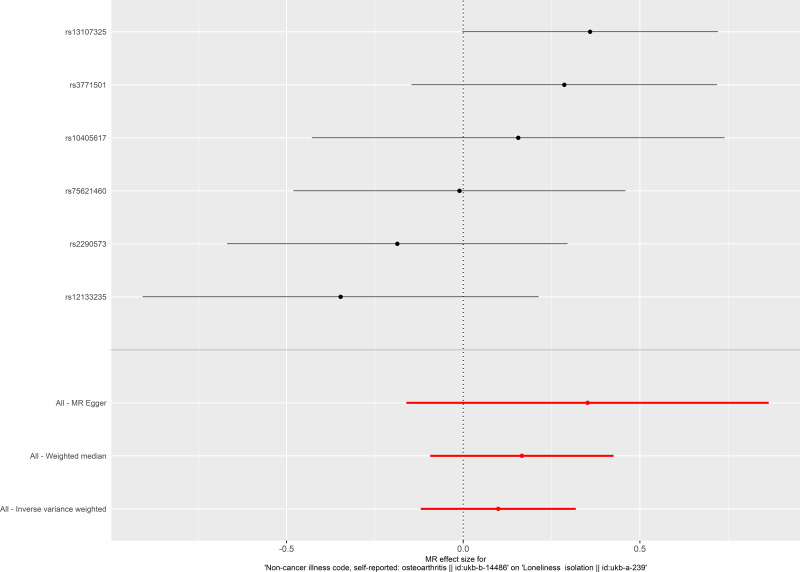
Figure 3.
Forest plot of the causal effect of osteoarthritis on social isolation. Black points represent the log odds ratio for social isolation by osteoarthritis, which is produced by using each single nucleotide polymorphism (SNP) selected as a separate instrument. Red points show the combined causal estimate using all SNPs together as a single instrument, using the three different Mendelian randomization methods. Horizontal line segments denote 95% confidence intervals of the estimate.

