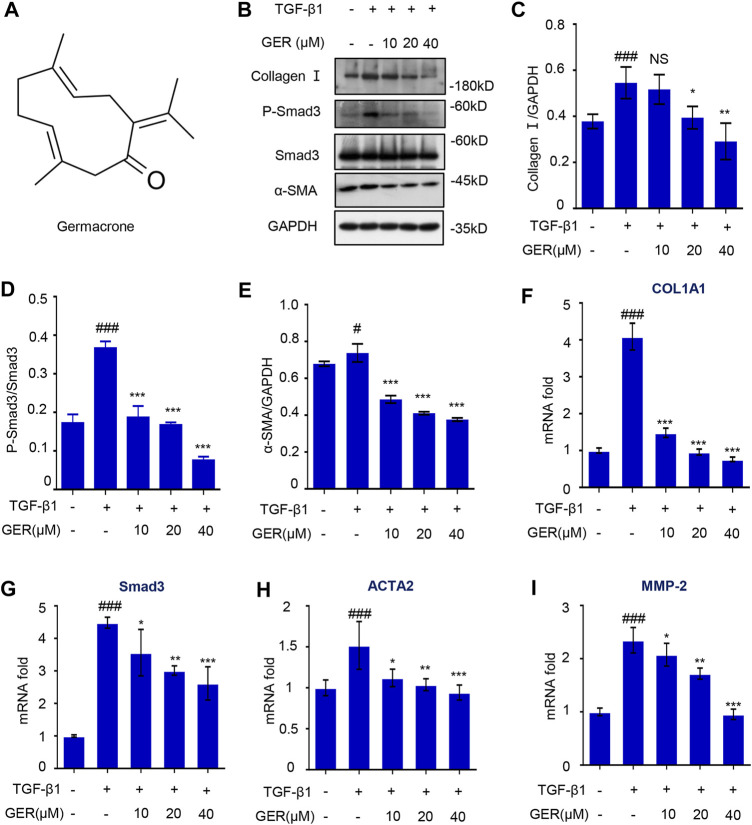
FIGURE 2.
GER suppresses TGF-β induced HSCs activation by inhibiting TGF-β/Smad signaling pathway. (A) The molecular structure of GER. (B) Western blot for collagen I, P-Smad3, Smad3, α-SMA protein level in LX-2, and GAPDH was used to as the loading control. (C–E) Quantitative analysis of collagen I, P-Smad3, Smad3, α-SMA, and GAPDH expression (n = 3). (F-I) Quantitative real-time PCR analysis of COL1A1, Smad3, ACTA2, and MMP-2 mRNA expression in LX-2. The ΔΔCt method was used to quantify relative changes (n = 3). All data are presented as means ± SEM. # p < 0.05, ### p < 0.001 vs. the control group. * p < 0.05, **p < 0.01, ***p < 0.001 vs. the TGF-β group. NS, non-significant vs. the TGF-β group.

