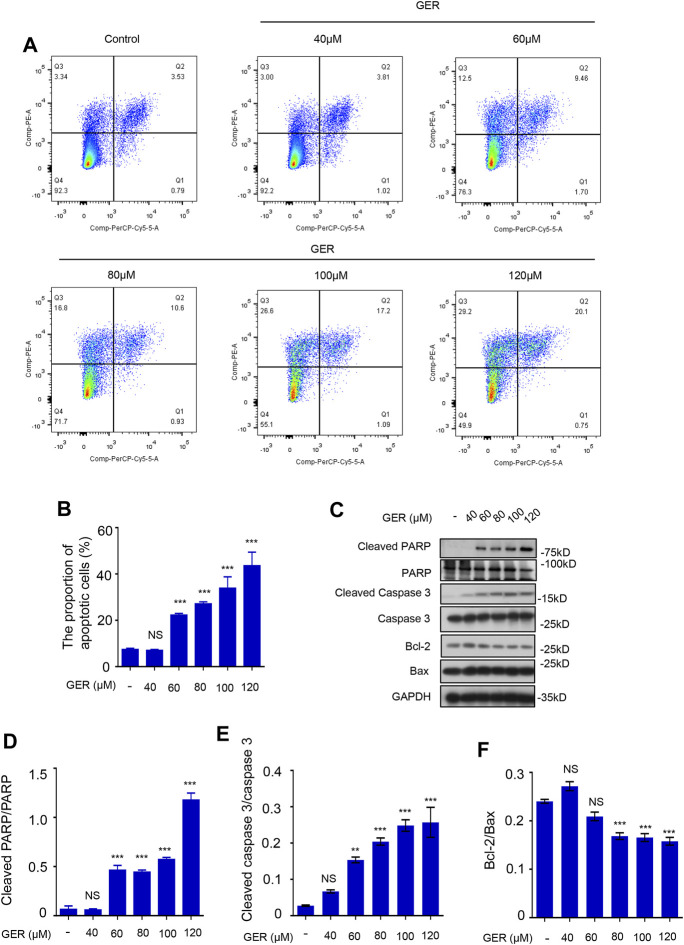
FIGURE 3.
GER promotes the apoptosis of HSCs. (A) Flow cytometric analysis of PI-stained apoptotic cells, and the cells in the upper right quadrant (Q2) were early apoptotic cells, and the cells in the upper left quadrant (Q3) were mid and late apoptotic cells. The apoptotic cells contained early, mid and late apoptotic cells. (B) Quantitative analysis of different group apoptotic cells after treatment with GER (n = 3). (C) Western blot for cleaved PARP, PARP, cleaved Caspase-3, Caspase-3, Bcl-2, Bax protein level in LX-2, and GAPDH was used as the loading control. (D–F) Quantitative analysis of cleaved PARP vs PARP, cleaved Caspase-3 vs. Caspase-3 and Bcl-2 vs Bax expression (n = 3). All data are presented as means ± SEM. * p < 0.05, **p < 0.01, ***p < 0.001 vs. the control group. NS, non-significant vs. the control group.

