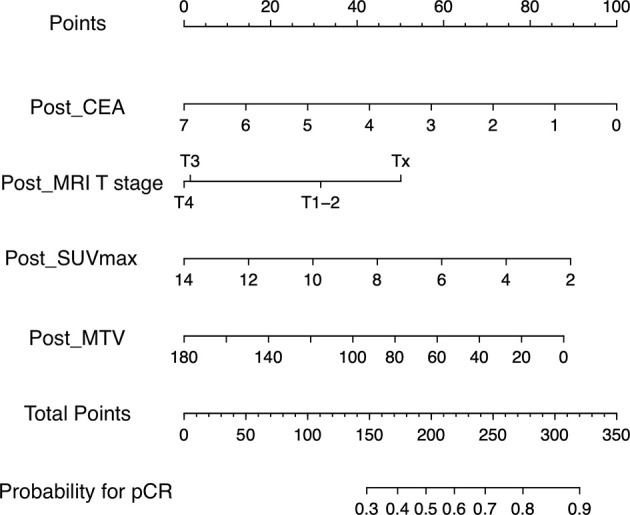
Figure 1.

Nomogram for predicting pathologic complete response. A point for each predictor can be read out along the top scale bar, ‘Points’. The sum of points or total points is converted to the ‘probability for pCR. pCR’ (CEA, carcinoembryonic antigen; MRI, magnetic resonance imaging; SUVmax, maximum value of standardized uptake value; MTV, metabolic tumor volume; pCR, pathologic complete response).
