Figure 3.
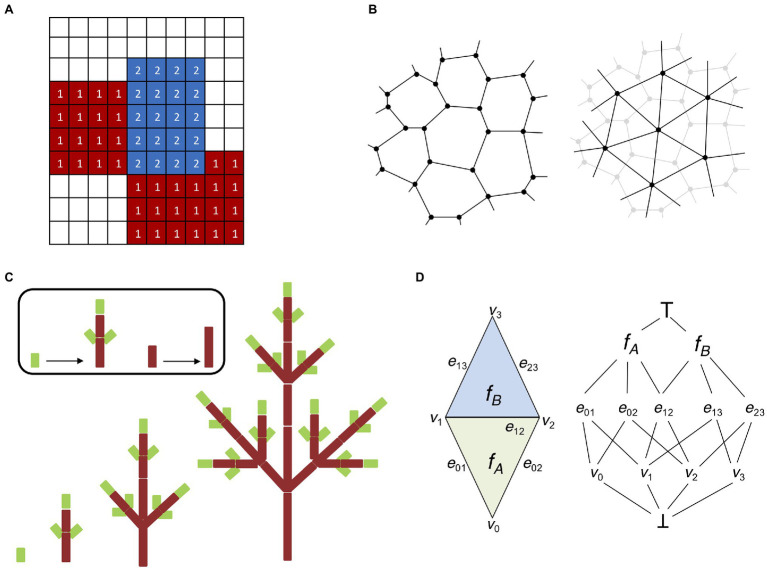
Digital representations of plant tissues. (A) Lattice grid representing a basic cellular potts model (CPM). Each element (or pixel) of the grid possesses a specific identity; in this case, we have two cellular types (indicated by 1 and 2) and a medium (no labeling). CPMs are solved by minimizing the Hamiltonian energy of the system, which allows the elements of each cellular type to “group together” and isolate from the surrounding medium. (B) Two possible ways to represent multicellular tissues with vertex-based models. Cells can be identified by their cell walls (left). Cell walls are represented as polygons made of vertices connected by edges shared with adjacent cells (in accordance with the biological properties of plant cell walls). Cells can be identified by their centroid (right). Cells are represented by a network of vertices and edges connecting the centroids of adjacent cells. Cell walls and boundaries can be abstracted in several ways, i.e., using Voronoi partitioning (Mosca et al., 2018). (C) L-systems modeling (adapted from Prusinkiewicz et al., 2018). An idealized realization of an L-system simulation is shown. The different stages of development of a simple tree branching structure are obtained from simple axioms and recursively applying procedural rules to a small group of elements. (D) Schematic representation of the “cell complex.” A simple two-dimensional cell complex made of two connected triangles (left) can be represented as an incident graph (right). Notice how the three cell dimensions (vertices, edges, and faces) occupy three different levels and share boundaries with each other. There are also two pseudocells ┴ and ┬ as the infimum and supremum of the incidence graph (see Prusinkiewicz and Lane, 2013 for details).

