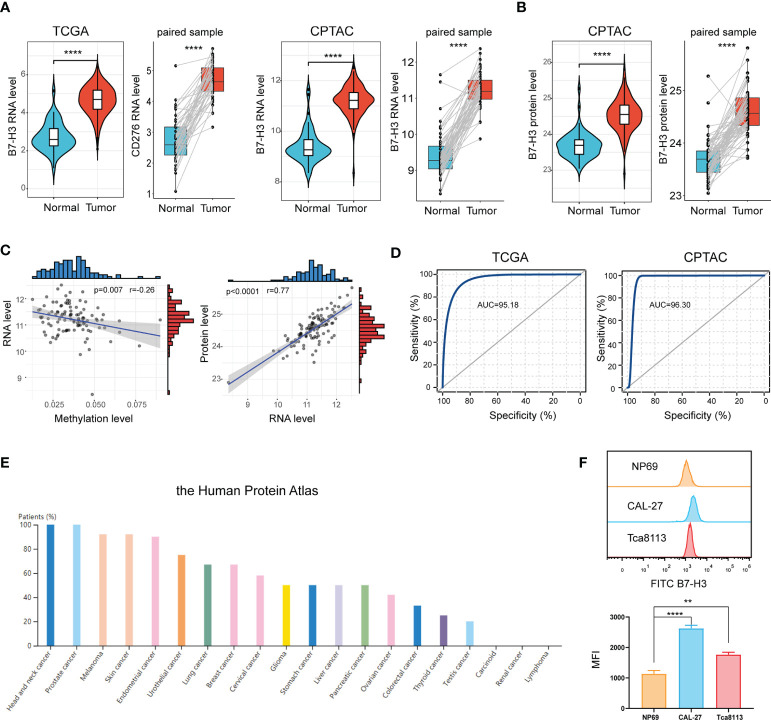
Figure 1.
B7-H3 is overexpressed in HNSCC. (A, B) Violin plot and box plot present the differentially expressed B7-H3 between HNSCC and normal sample; (C) Scatter plots show the association of B7-H3 RNA expression with protein expression and DNA methylation; (D) ROC curves indicate the diagnostic value of B7-H3; (E) The protein expressions of B7-H3 in different tumors; (F) Expression level of B7-H3 in NP69, CAL-27 and Tca8113; **P < 0.01 & ****P < 0.0001.

