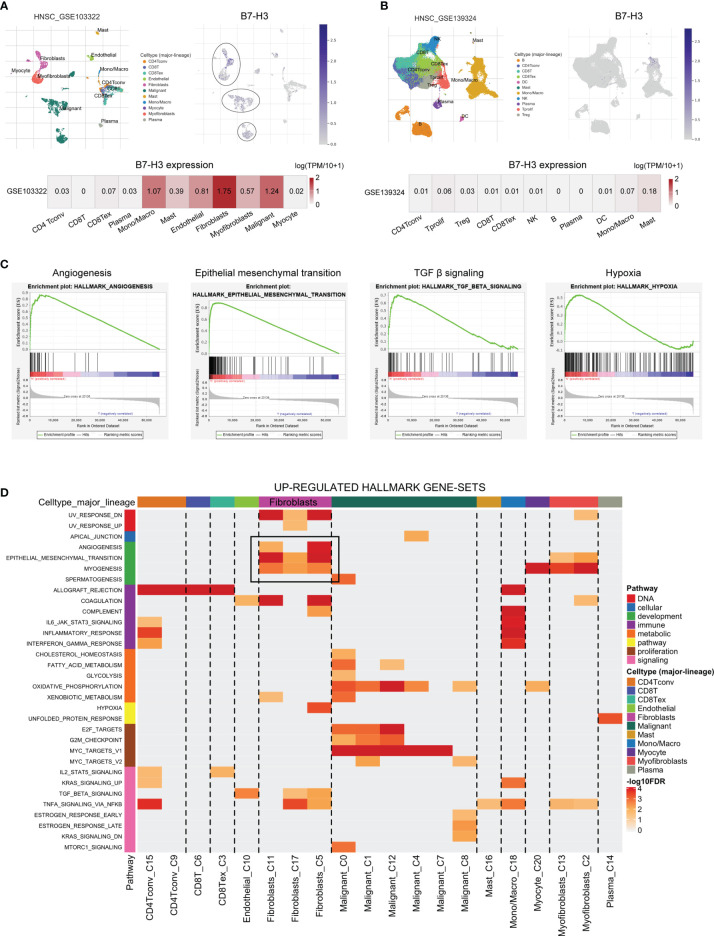
Figure 3.
The single-cell RNA sequencing analysis exhibits the expression pattern as well as the signal pathway of B7-H3. (A, B) The t-SNE projection of all cells and B7-H3 expression from GSE103322 and GSE139324; (C, D) GSEA derived from bulk RNA-seq (C) and scRNA-seq (D) data presents the underlying pathway associated with B7-H3.

