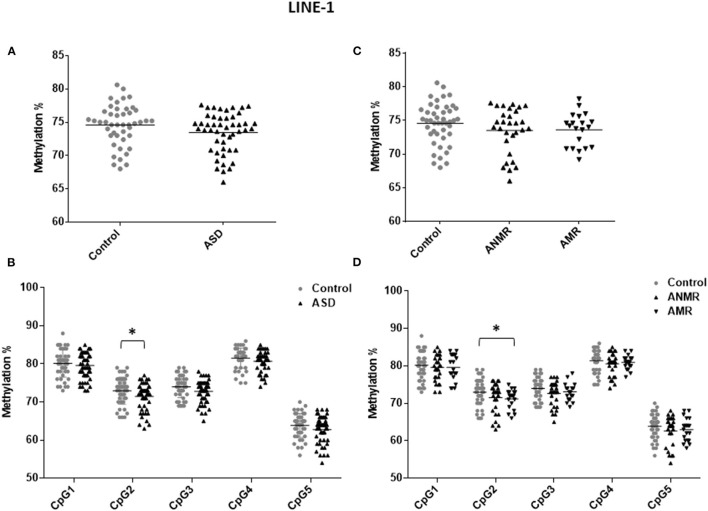
Figure 1.
Scatter plot showing comparisons of methylation status of LINE-1 in children with autism spectrum disorders (ASD) compared to controls. (A,B) Methylation levels and differentially methylated sites (CpG1–CpG5) in the LINE-1 sequence in ASD group and healthy control group. (C,D) Methylation levels and differentially methylated sites in the LINE-1 sequence in ASD group subdivided as follows: ANMR (non-mental regression group), AMR (mental regression group), and a healthy control group. The dark bars represent the mean values of each group. Asterisks indicate statistically significant differences (*P ≤ 0.05) compared to control group.

