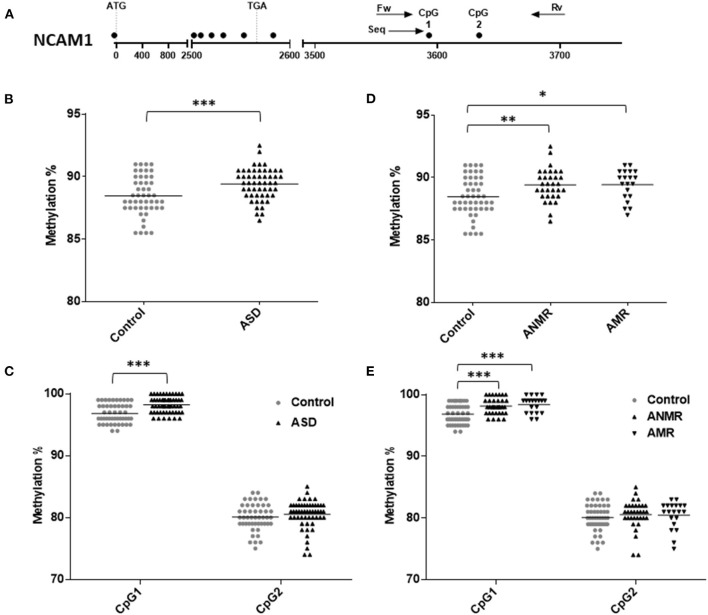
Figure 2.
Scatter plot showing comparisons of methylation status of NCAM1 in children with autism spectrum disorders (ASD) compared to controls. (A) Schematic diagram of analyzed gene. Each circle represents a CpG dinucleotide. Position of ATG and TGA codon are indicated. Arrows show the location of pyrosequencing primers. (B,C) Methylation levels and differentially methylated sites (CpG1 and CpG2) in the NCAM1 gene in ASD group and healthy control group. (D,E) Methylation levels and differentially methylated sites in the NCAM1 gene in ASD group subdivided as follows: ANMR (non-mental regression group), AMR (mental regression group), and a healthy control group. The dark bars represent the mean values of each group. Asterisks indicate statistically significant differences (*P < 0.05; **P < 0.01; ***P < 0.001) compared to control group.

