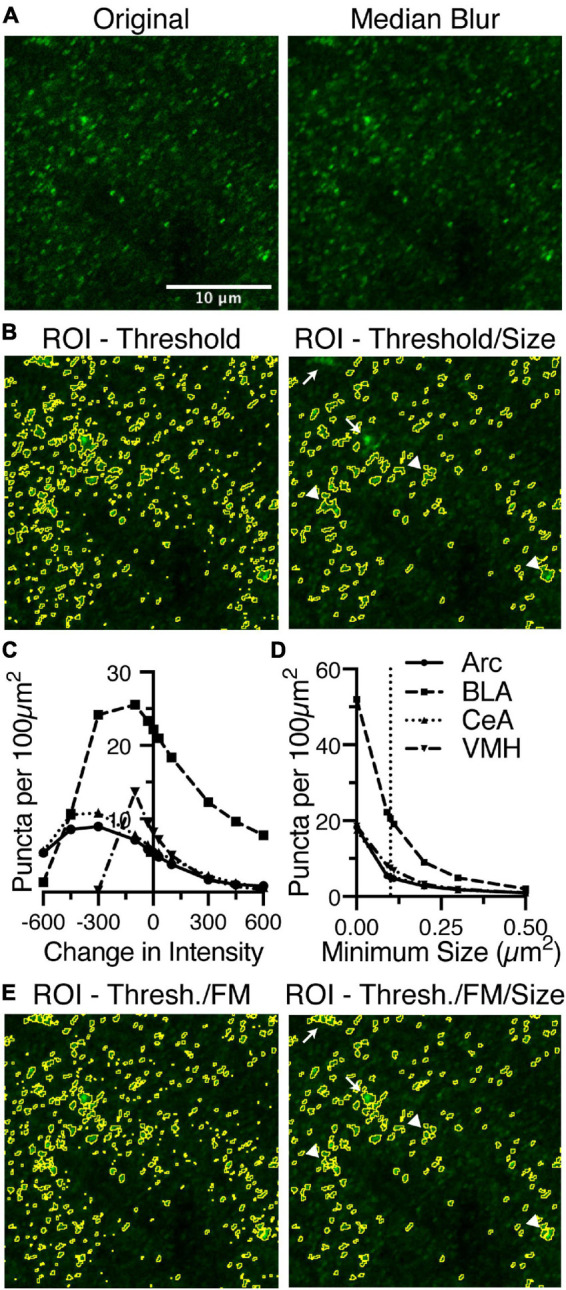
FIGURE 3.

Identification of puncta in sparsely labeled images are dictated by an intensity threshold and minimum size and may still be enhanced by using the same process as densely labeled images. (A) Anti-gephyrin staining in BLA is one such marker that is sparsely labeled. The original image is median blurred to smooth noise. (B) The ROIs, circled in yellow, selected based upon a threshold intensity are further refined by removing puncta that are too small or big. (C) Gephyrin puncta was examined in four brain regions (Arc, dot continuous line; BLA, squares and dashed line; CeA, triangles and dotted line; VMH, inverted triangle and dash-dot line) Puncta number are negatively correlated with changes in threshold intensity, until the threshold has been reduced too far. (D) Puncta number is also negatively correlated with changes in minimum size. (E) Reanalysis of anti-gephyrin staining in BLA using the dense analysis method identified different puncta. Puncta denoted by arrows are absent from the final image in panel (B) while present in the final image in panel (E). Puncta denoted by arrowheads are present in image panel (B), but have been sub-divided in panel (E). Scale bar denoted in panel (A) is 10 μm for all images.
