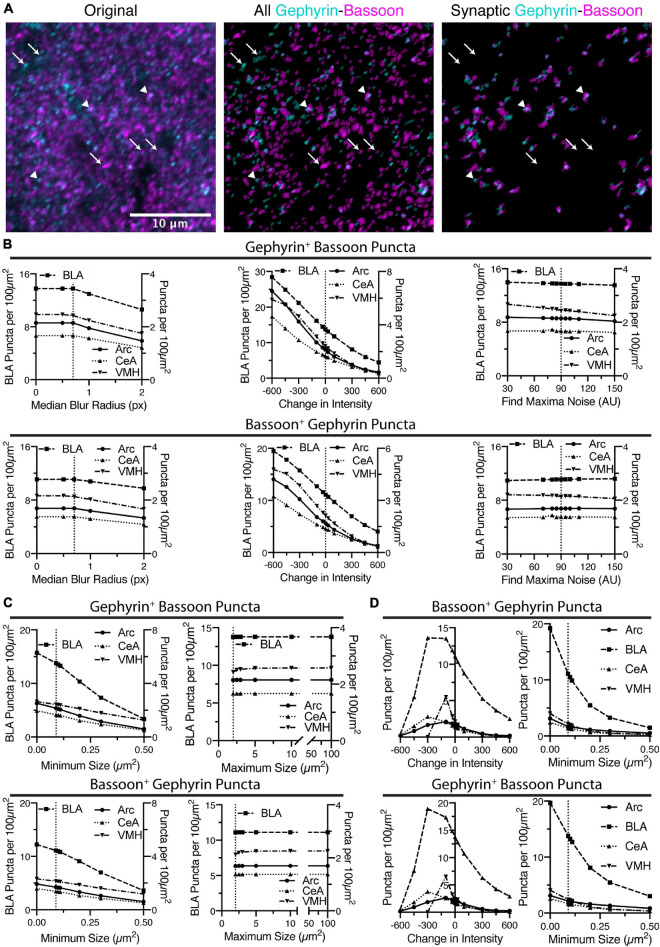
FIGURE 4.
Identification of putative synapses is done by finding overlap between puncta identified in the two images. (A) In the following sequence of images, gephyrin is colored in cyan and bassoon colored in magenta. Shown is the original two channel image, all of the identified puncta in both channels, and then the final identification of overlapping puncta. Some puncta are eliminated (identified with white arrows), while remaining, overlapping puncta are putative synaptic contacts (identified with white arrowheads). Scale bar, 10 μm, applies to all images. (B) Increasing the threshold intensity for bassoon puncta reduces synaptic puncta density, for either gephyrin-positive bassoon puncta or bassoon-positive gephyrin puncta. Increasing radius for median blur or the noise value for “Find Maxima” cause relatively little changes in synaptic puncta density. Trends in synaptic puncta density are largely similar between brain regions. (C) Increasing minimum size of synaptic puncta decreases puncta density across all brain regions, while increasing maximum size leads to little change in synaptic puncta density. (D) Similar to the dense puncta identification, using the sparse identification method leads to synaptic puncta being negatively correlated with changes in minimum size of puncta. However, decreasing the intensity threshold too much leads to a decrease in synaptic puncta density.

