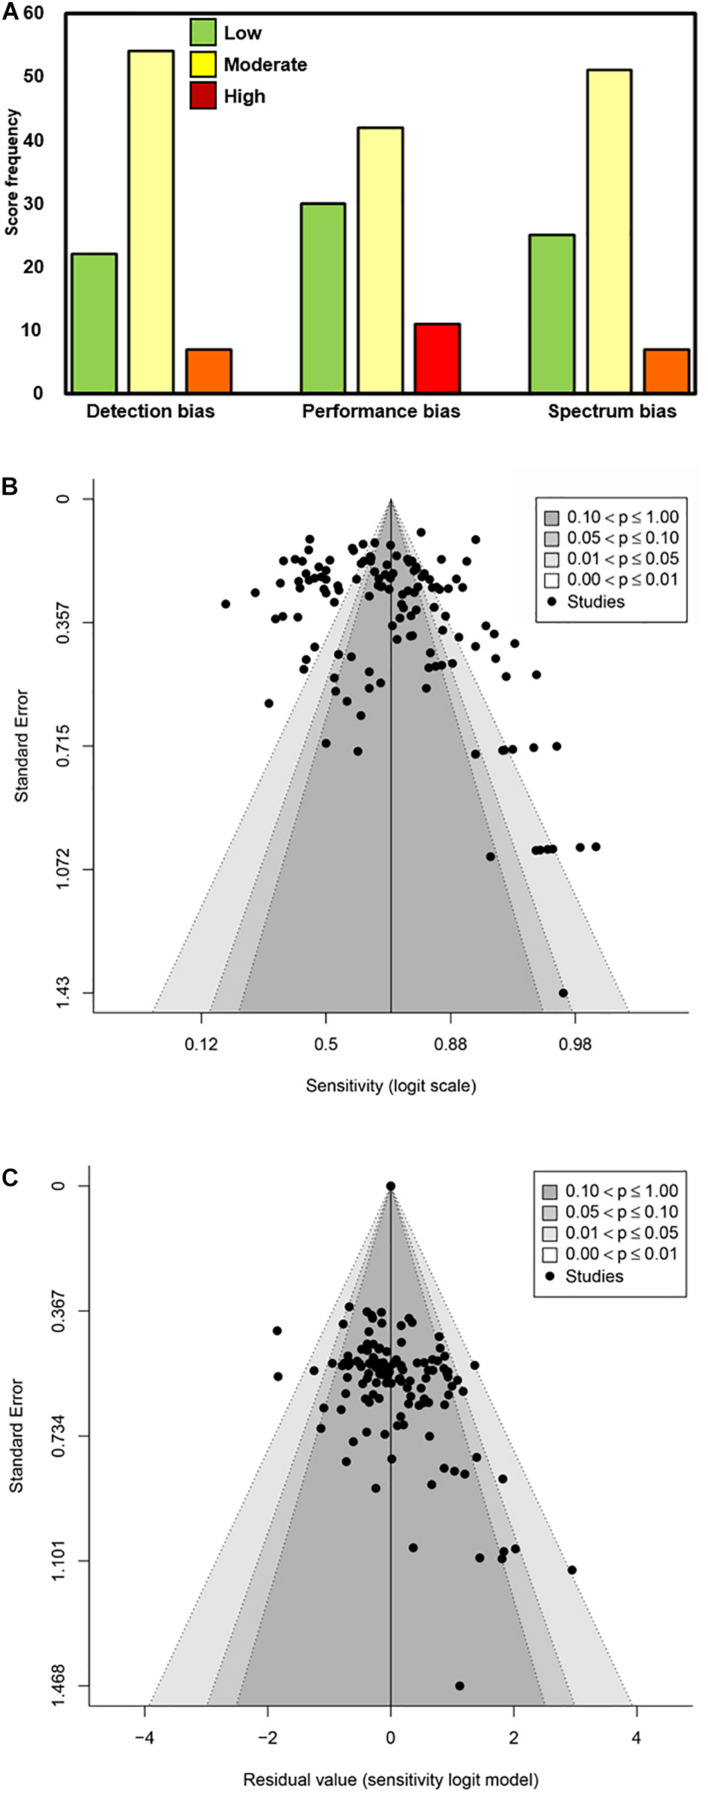
FIGURE 3.
Determination of bias associated with the source articles/documents included in this meta-analysis. (A) Scoring as Low, Moderate, and High was performed for Detection bias, Performance bias, and Spectrum bias associated with each data source included. The frequency of the scores is plotted along the Y-axis. (B,C) Funnel plots of logit-transformed sensitivity in a model without any moderators (B) and with moderators included (C).

