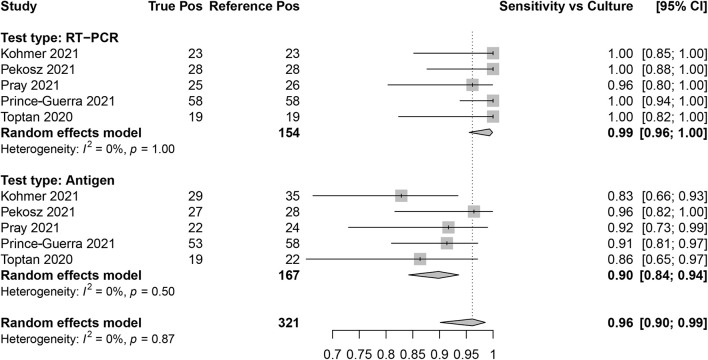
FIGURE 6.
Forest plots containing calculated sensitivity values for index [severe acute respiratory syndrome coronavirus-2 (SARS-CoV-2) antigen test and SARS-CoV-2 quantitative reverse transcription polymerase chain reaction (RT-qPCR assay)] testing compared to reference (SARS-CoV-2 viral culture) test.

