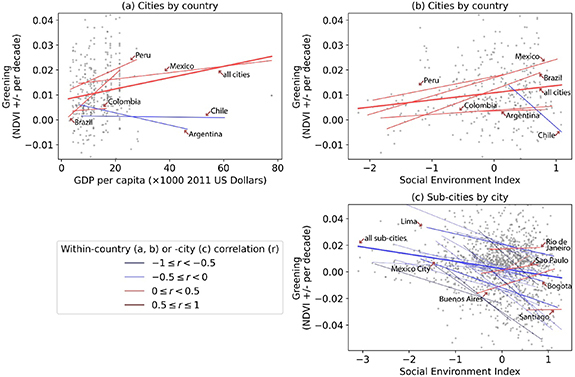
Figure 4.

Associations between greening (changes in greenness per decade) and SES variables at city (a), (b) and sub-city (c) levels. The dots represent cities nested in countries (a), (b) or sub-cities nested in cities (c). The dash lines are country- or city-specific linear fits between greening and a SES variable, with their correlations shown in colors. Due to smaller sample sizes, countries with less than ten cities and cities with less than ten sub-cities are excluded from the linear fit and correlation analysis. For display purpose, the plots are constrained to the middle 90% range of greening.
