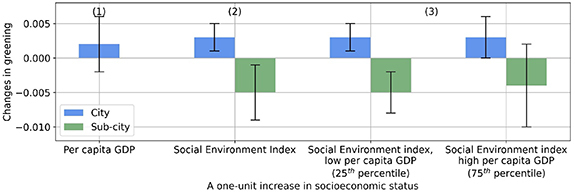
Figure 5.

Average marginal effect (AME) of social economic status on greening (changes in greenness per decade). AME is the change in greening for a one-unit increase in a SES variable when holding other covariates constant, averaged across the samples. A one-unit increase corresponds to a 10 000 USD raise in per capita GDP and an interquartile range increase in Social Environment Index. The 95% confidence intervals for the AMEs are shown in error bars. AMEs for cities in columns (1)–(3) are estimated based on models (6)–(8) in table S4. AMEs for sub-cities in columns (2) and (3) are estimated based models (9) and (10) in table S4.
