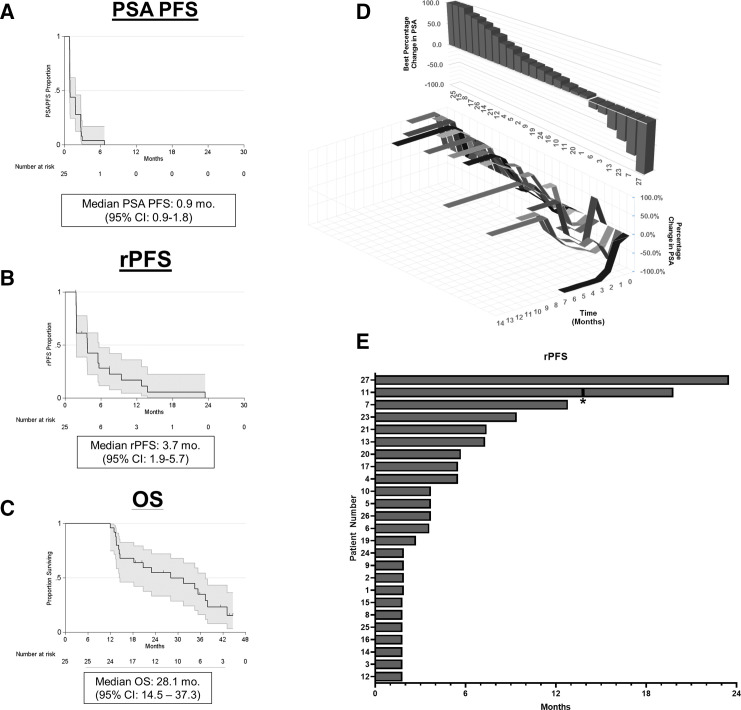
Figure 2.
Secondary efficacy outcomes. A) PSA progression free survival (PSA PFS). B) Radiographic progression free survival (rPFS). Tick marks denote censored events. C) Overall survival (OS). D) Waterfall plot of best percentage change from baseline in PSA (top) and changes in PSA over time (bottom). Changes +100% were capped at 100%. E) Swimmer’s plot of radiographic progression free survival (rPFS) in months. *Denotes patient who was re-treated per-protocol.

