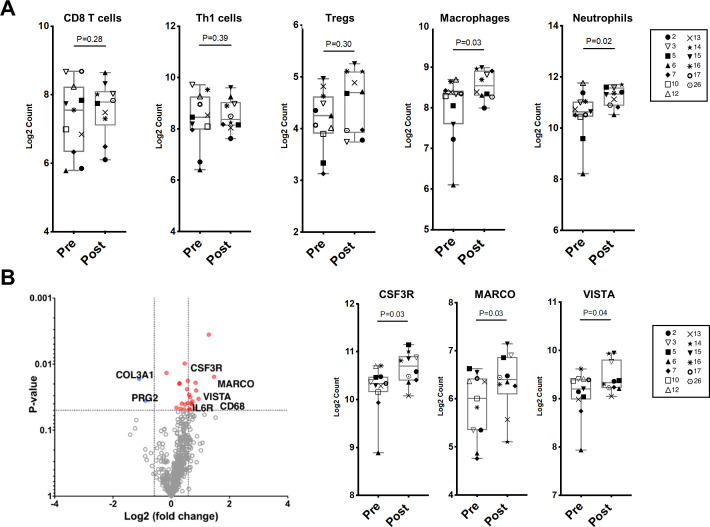
Figure 3.
Changes in immune cell subsets and specific immune markers in bone marrow aspirates by Nanostring RNA expression profiling after tremelimumab and durvalumab. A) Scatter plots of immune cell phenotypes in bone marrow aspirates pre- and post-treatment with tremelimumab and durvalumab. B) Left: Volcano plot of differentially expressed genes (Log2 FC>1.2 and p-value <0.05) pre-and post-treatment. (Pre in blue, n=11; post in red, n=10). Right: Scatter plots showing expression of specific immune markers pre- and post-treatment.

