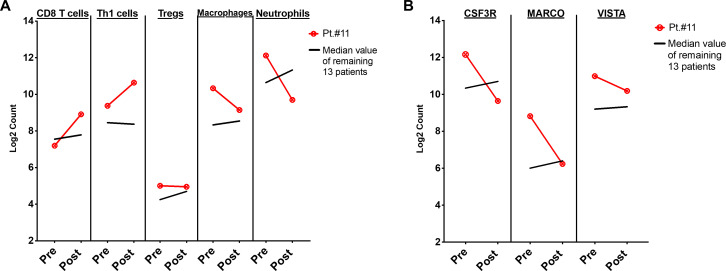
Figure 4.
Changes in immune cell subsets and specific immune markers in a patient with prolonged response (#11). A) Line graphs showing immune cell phenotypes by Nanostring at baseline (Pre), and after treatment with tremelimumab and durvalumab (Post) in patient #11. B) Line graphs showing expression of immune markers by gene expression at baseline (Pre), and after treatment with tremelimumab and durvalumab (Post) for patient #11. Red line denotes patient #11; black line denotes median values of each cell type/immune marker for remaining 13 patients.

