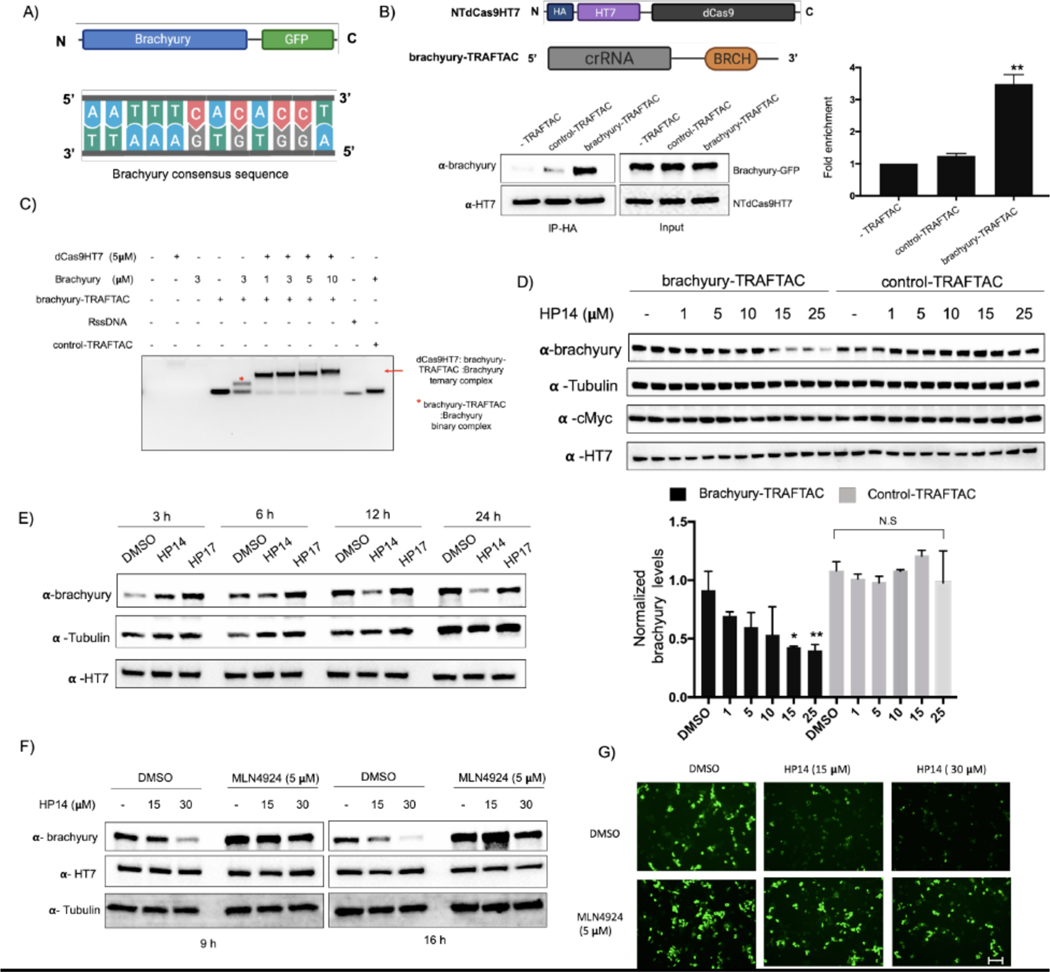
Figure 5. TRAFTACs Targeting Brachyury Induces its Degradation.
A) Schematic representation of the brachyury-GFP construct and the brachyury binding DNA sequence.
B) Cell lysates that overexpress brachyury-GFP were incubated with the brachyury-TRAFTAC and the inactive control-TRAFTAC before HA immunoprecipitation. Eluted samples were probed against brachyury and HT7 levels.
C) Ternary complex formation assay for the dCas9HT7:chimeric oligo and brachyury. Purified proteins were incubated with chimeric oligos and protein:oligo complexes were separated using DNA agarose gel to analyze gel shifts as depicted in the figure.
D) Cells stably expressing brachyury-GFP were transfected with brachyury-TRAFTAC or control-TRAFTAC followed by HP14 treatment. Cells were then lysed and analyzed for brachyury, tubulin, c-Myc and HT7 levels. (Not significant (N.S); * P < 0.03; ** p<0.002; n: Independent biological replicates; n=2)
E) Time dependent degradation of brachyury-GFP. Cells stably expressing brachyury-GFP were transfected with brachyury-TRAFTAC and treated with HP14 and HP17. Cells were lysed at indicated time points, subjected to western blotting and probed for brachyury, tubulin and HT7.
F) Stable cells overexpressing brachyury-GFP were treated with HP14 and MLN4924 for 9 and 16 h. Cells were lysed and probed for brachyury, HT7 and tubulin.
G) The brachyury-GFP fluorescence signal was captured after HP14 and MLN4924 co-treatment. Scale bar: 75 μm.

