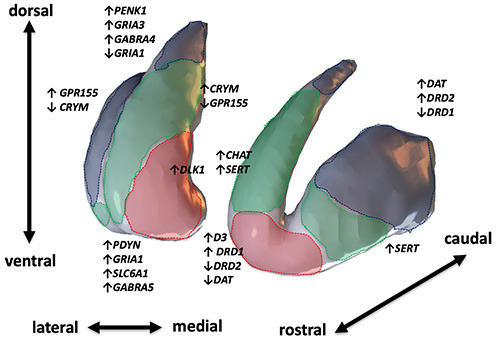
Figure 2.

Molecular diversity of striatal subterritories. Some examples of molecular markers which show differential expression across different territories of the striatum. Dotted borders encompass putative functional striatal territories defined by cortical connections; red, limbic-ventral; green, associative-dorsal; blue, sensorimotor-caudal. Boundaries of limbic, associative and sensorimotor territories have been drawn manually for schematic visualization purpose considering the evidence of available studies in literature. Among molecular markers, some show a graded expression across the rostral-caudal (e.g., DAT, dopamine receptors) or medial-lateral axis (e.g, CRYM; GPR155; DLK1); other discriminate between dorsal and ventral striatum (PDYN; PENK1; GABRA4; GABRA5) and other are increased in specific subterritories which are less clearly related to cortical topography (e.g., CHAT, SERT). Additionally, it has been suggested that D2-expressing projection neurons (not showed) show topographically specific expression patterns.88
