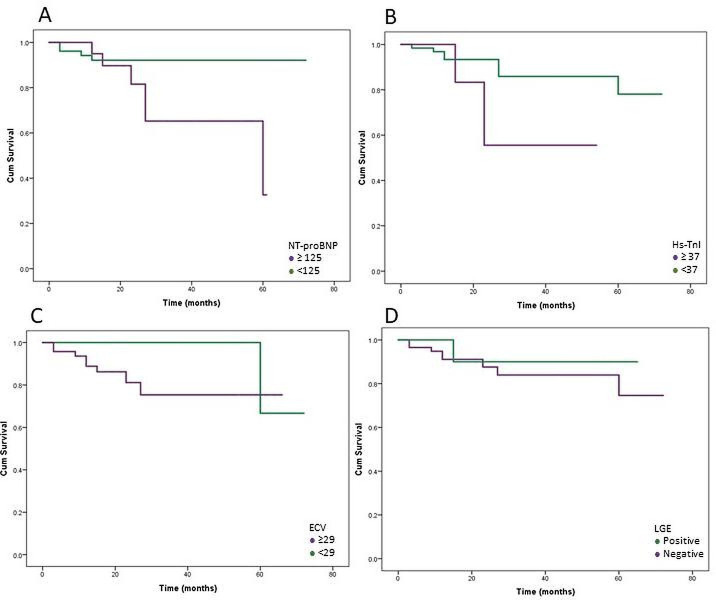
Figure 1.
Time-to-event plots for cardiovascular outcomes. (A) Time-to-event plots in patients with normal and abnormal NT-proBNP. (B) Time-to-event plots in patients with normal and abnormal hs-TnI. (C) Time-to-event plots in patients with normal and abnormal ECV. (D) Time-to-event plots in patients with and without LGE. ECV, extracellular volume; hs-TnI, high-sensitivity troponin I; LGE, late gadolinium enhancement; NT-proBNP, N-terminal pro-brain natriuretic peptide.

