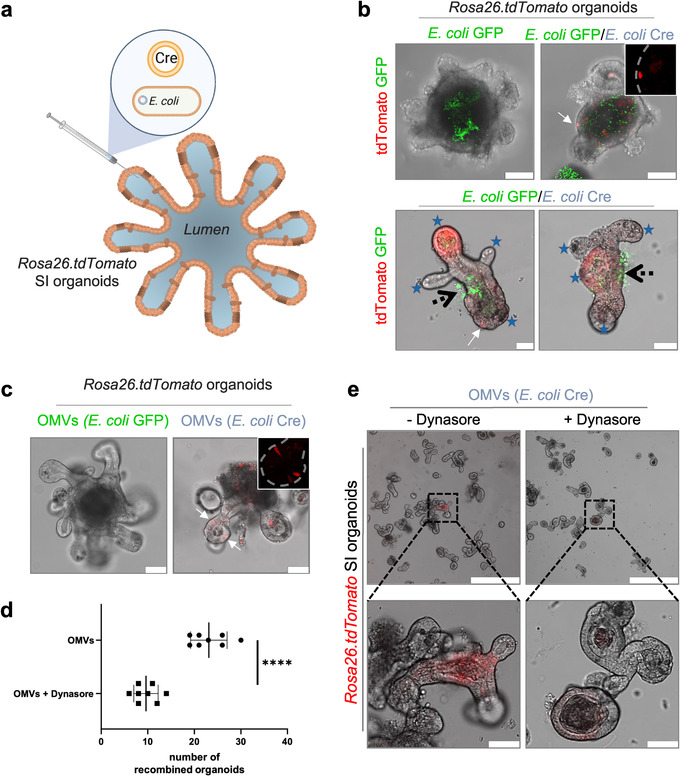
FIGURE 2.

OMV uptake by intestinal epithelial cells. (a) Experimental set up of in vitro experiments. Organoids received either 4*104 bacteria or 4*105 OMVs via microinjection. (b) Small intestinal organoids derived from Rosa26.tdTomato mice were microinjected with E. coli GFP (left, Green) or E. coli Cre plus E. coli GFP (right, Green 1:1 dilution). Pictures were taken 8 (upper panel) or 20 (lower panel) hours post injection. Successful transfer of bacterial Cre to host cells is traceable by tdTomato‐positivity (red). Scale Bar: 50 μm. Inset: Higher magnification of tdTomato‐positive signal only (red). Experiments were repeated three times with similar results. Stars mark crypt region, black arrows label side of microinjection, white arrow marks individual tdTomato positive epithelial cell. (c) Representative confocal pictures of small intestinal organoids (Rosa26.tdTomato) microinjected with OMVs derived from E. coli GFP (left) or E. coli Cre (right). Confocal images were taken 8 hours after microinjection. Experiments were repeated three times with similar results. (d) Quantification and (e) representative confocal images of small intestinal organoids derived from Rosa26.tdTomato mice after microinjection with purified OMVs (E. coli Cre) cultured in the absence (‐Dynasore) or presence (+Dynasore) of the dynamin GTPase inhibitor Dynasore. The data are depicted as the mean of the number of organoids that displayed tdTomato positive cells (independent of intensity). The dot plots depict the mean of one analysed culture [with 100 microinjections] and the whiskers min–max values. ****P < 0.0001. Data are derived from two independent experiments.
