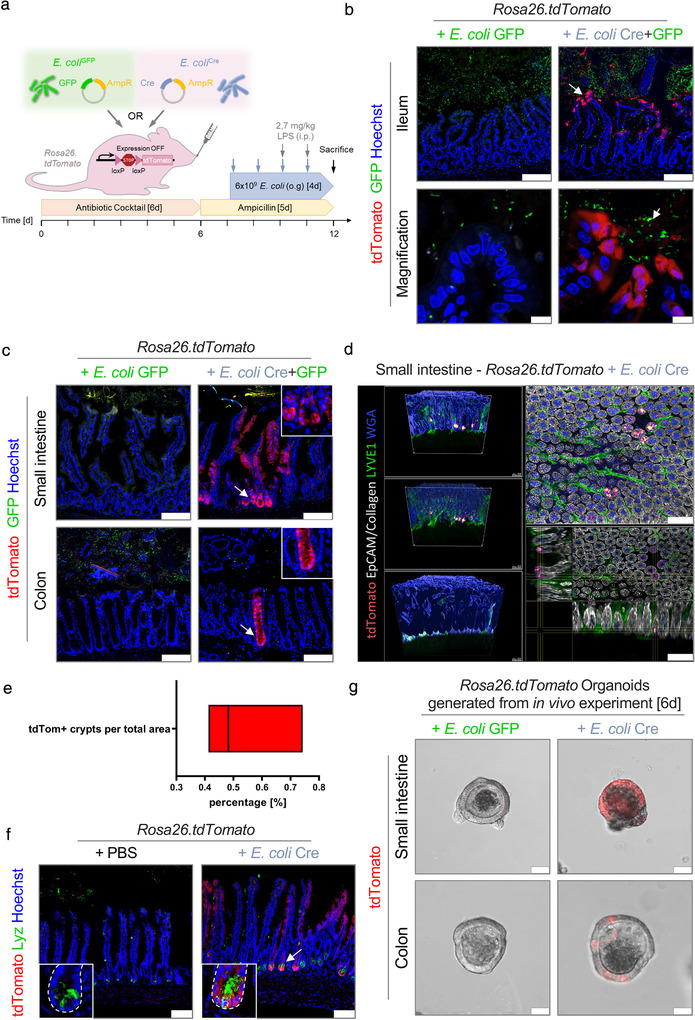
FIGURE 3.

In vivo transfer of bacterial Cre to mucosal host cells. (a) Experimental set up of in vivo experiments. (b+c) Representative data derived from the intestinal tissue of Rosa26.tdTomato mice treated with either E. coli Cre plus E. coli GFP (n = 9) or with E. coli GFP only (n = 5). Experiments were performed in three independent experiments with similar results. (b) Representative confocal images of small intestinal (Ileum) cryo‐cross sections showing tdTomato‐positive epithelial cells (red) and E. coli GFP (green). Nuclei counterstaining with Hoechst (blue). Scale bar: 100 μm; Magnification, Scale bar: 10 μm. (c) Representative images of small intestinal and colonic cross‐sections demonstrating tdTomato‐positive cells (red) and E. coli GFP (green). Inset: Higher magnification of the stem cell region. Nuclei counterstaining with Hoechst (blue). Scale bar: 100 μm. (d) Volumetric reconstruction images of Rosa26.tdTomato intestinal mucosa treated with E. coli Cre showing red‐to‐white gradient with tdTomato signal in crypts (red), as well as collagen (SHG; grey), epithelial cells (EpCAM; grey), LYVE1 (green), and WGA (blue). Total analysis of 10,000 ileal crypts derived from Rosa26.tdTomato mice treated with E. coli Cre (n = 3). Scale bar: 100 μm. (e) Quantification of tdTomato‐positive crypts per sample area. (f) Representative immunohistochemical images of small intestinal (Ileum) cryo‐cross sections of Rosa26.tdTomato mice treated with E. coli Cre or PBS as control. Confocal pictures visualized tdTomato‐positive cells (red) and staining against Paneth cells (Lyz, Green). Nuclei counterstaining with Hoechst (blue). Scale bar: 100 μm. (g) Representative confocal images of organoids derived from the small and large intestine of Rosa26.tdTomato mice colonized with E. coli Cre (right) or as a control E. coli GFP (left) 6 days after isolation. Scale Bar: 50 μm. Experiments were repeated three times with similar results
