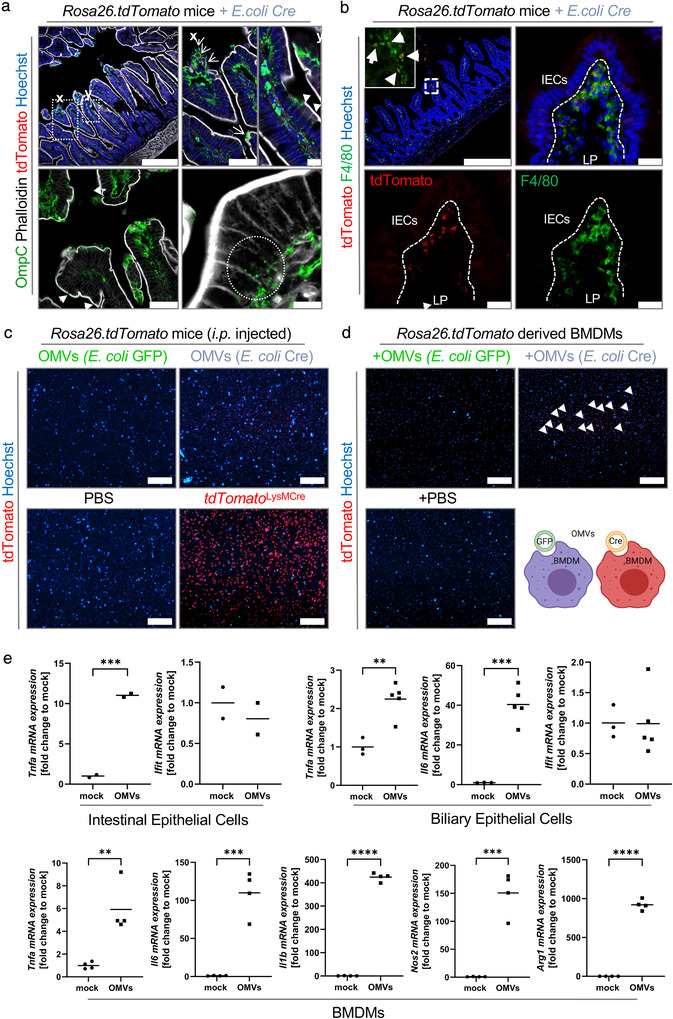
FIGURE 4.

OMV uptake within the gut mucosa. (a) Representative confocal images of small intestinal (Ileum) cryo‐cross sections derived from Rosa26.tdTomato mice that received E. coli Cre and LPS stained with an antibody against OmpC to visualize OMVs and Phalloidin to stain actin filaments. Nuclei counterstaining with Hoechst (blue). Scale bar: 250 μm; Magnification, Scale bar: 75 μm and 10 μm. Arrows point towards damaged surface epithelium, arrow heads point towards OMVs within epithelial cells and at the apical surface of goblet cells. (b) Representative confocal images of small intestinal (Ileum) cryo‐cross sections derived from Rosa26.tdTomato mice that received E. coli Cre (+LPS) showing tdTomato positive macrophages. Nuclei counterstaining with Hoechst (blue). Scale bar: 250 μm; Magnification, Scale bar: 50 μm. Arrows point towards tdTomato positive macrophages. (c) Representative microscopic pictures of peritoneal macrophages isolated from Rosa26.tdTomato mice i.p. injected with 2*109 particles of OMVs purified from E. coli Cre or E. coli GFP or mice treated with PBS (negative control) or isolated from Rosa26.tdTomatoxLysMCre (positive control). Nuclei counterstaining with Hoechst (blue). Scale bar: 100 μm. (d+e) Cell cultures were treated with 2*109OMVs/ml. (d) Representative pictures of peritoneal macrophages isolated from Rosa26.tdTomato mice cultured in the presence of isolated OMVs (E. coli Cre or E. coli GFP) or treated with PBS as control. Nuclei counterstaining with Hoechst (blue). Scale bar: 100 μm. (e) mRNA expression of indicated genes in intestinal epithelial cells (2D monolayer derived from murine small intestinal organoids), biliary epithelial cells (2D monolayer derived from murine liver ductal organoids) and BMDMs cultured for 8 h in the absence (mock) or presence of OMVs. Gene expression levels are shown relative to Gapdh. ****P < 0.0001, ***P < 0.001, **P < .01
