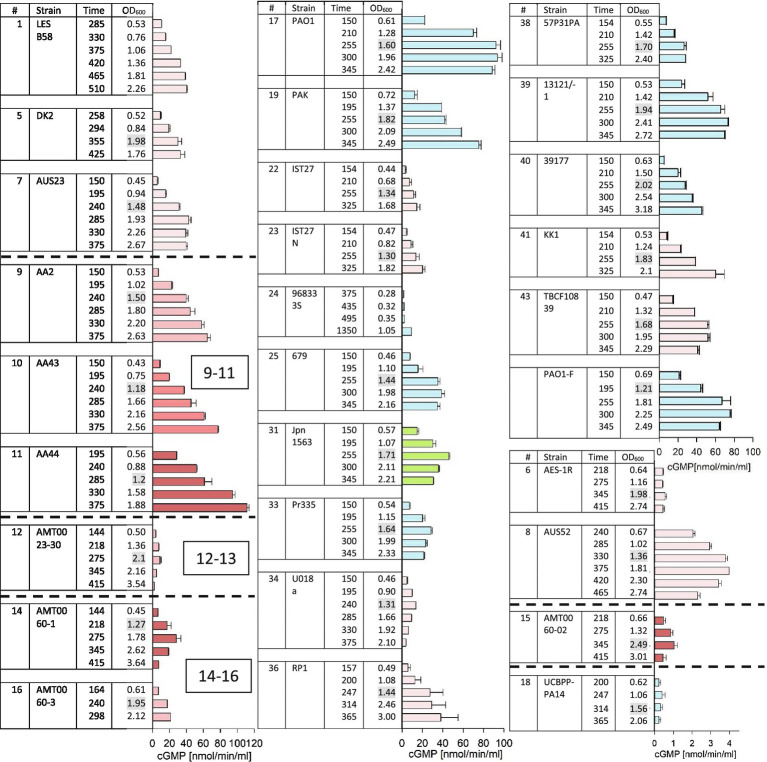
Figure 2.
ExoY prevalence in a subset of strains from the international P. aeruginosa panel. GC activity was measured as described in Material and Methods in bacterial culture supernatants induced for T3SS expression with addition of EGTA. Strains that were predicted to lack ExoY activity due to frameshift P242 as described in Supplementary Figure 1 (#13, 26, 29, 30, 32, and 42) and strains that had activities below 0.2nmol/min/ml (#2, 3, 4, 20, 27, and 37) are not shown here. Cultures were inoculated (at an OD600 of 0.05) into LB supplemented with 5mM EGTA and 20mM MgCl2 to induce the T3SS. We started to collect 1ml aliquots for activity assays during the exponential growth phase starting from an OD600 of 0.5 and continued after bacteria had entered the stationary phase of growth. Elapsed period of time (min) since the start of cultures and OD600 of the collected samples are indicated in the table. OD600 values highlighted in grey indicate first samples that were taken after cultures had entered the stationary growth phase. GC activities were measured using 15μl of bacterial culture supernatant and correspond to averages of at least two measurements. Error bars indicate SD. Pink bars represent samples from cystic fibrosis (CF) isolates with darker shades corresponding to later isolates within a set of sequential isolates from the same patient. Blue bars represent non-CF isolates of clinical origin. Green represents the only environmental isolate among the strains with activities of ≥1nmol cGMP/min/ml.

