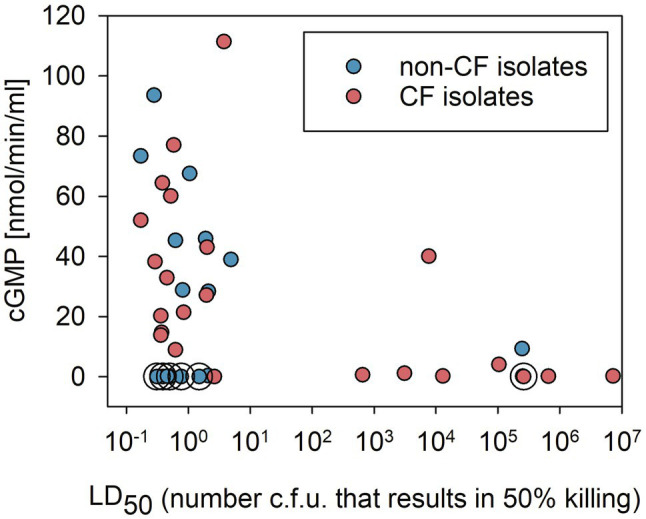
Figure 3.

Correlation between virulence in a Galleria mellonella infection model (virulence data from Cullen et al., 2015) and ExoY GC activity in bacterial strains from the international P. aeruginosa reference panel categorized into CF or non-CF isolates. GC activities plotted correspond to the averages of peak values shown in Figure 2. Circles around data points indicate that these samples correspond to strains that were predicted to lack ExoY activity due to the presence of frameshift P242 in exoY as described in Supplementary Figure 1A.
