Figure 2.
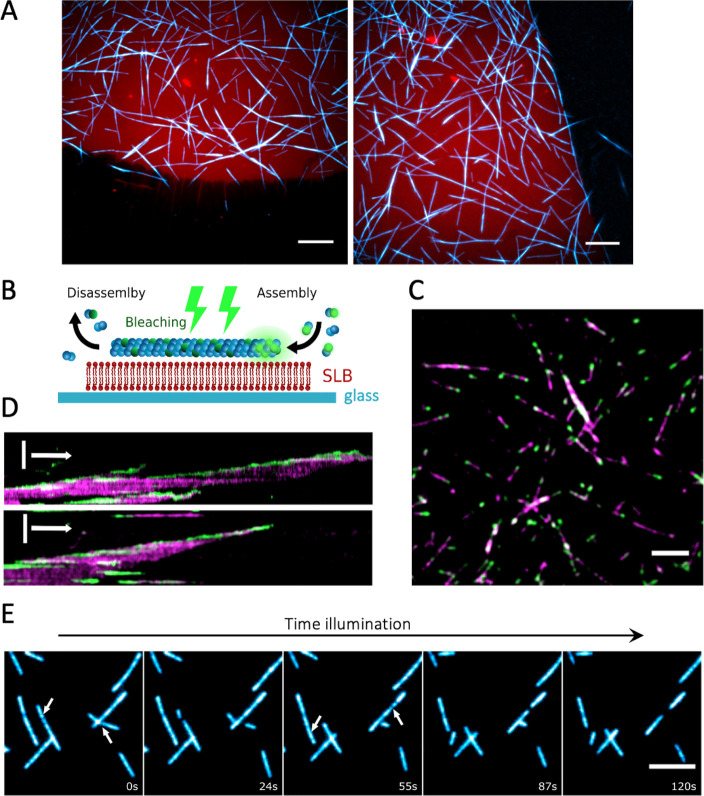
Dynamics of bMTs formed by purified proteins on SLBs. (A) Fluorescence microscopy images showing the selective binding of bMTs (cyan, Atto488-BtubA/B) onto an SLB (red, DHPE-TexasRed). Concentration of bacterial tubulins was 2.5 μM. Scale bars: 10 μm. (B) Schematic of the dual color labeling assay to study bMT dynamics on an SLB. Purified BtubA/B proteins labeled with either Atto488 or Atto565 were used. Atto488-labeled bacterial tubulins were bleached continuously during imaging. The only active Atto488 fluorophores are located at the plus end of the filament, where new subunits incorporate. (C) Bleached filaments display fluorescent ends that originate from the continuous addition of fresh, unbleached Atto488-BtubA/B (green). Atto565-BtubA/B is colored in magenta. Scale bar: 5 μm. (D) Kymographs show bMT dynamics during a photobleaching. Data from two different bMTs are shown. Color coding is the same as in (C). Addition of subunits at the growing end can be seen as the continuous upward drift of the green signal over time. Vertical scale bar: 5 μm. Horizontal arrow: 1 min. (E) Time series images show bMT disassembly events during a high-intensity illumination. Arrows indicate the locations at which the filaments break apart. Illumination time points are appended on each image. Scale bar: 5 μm.

