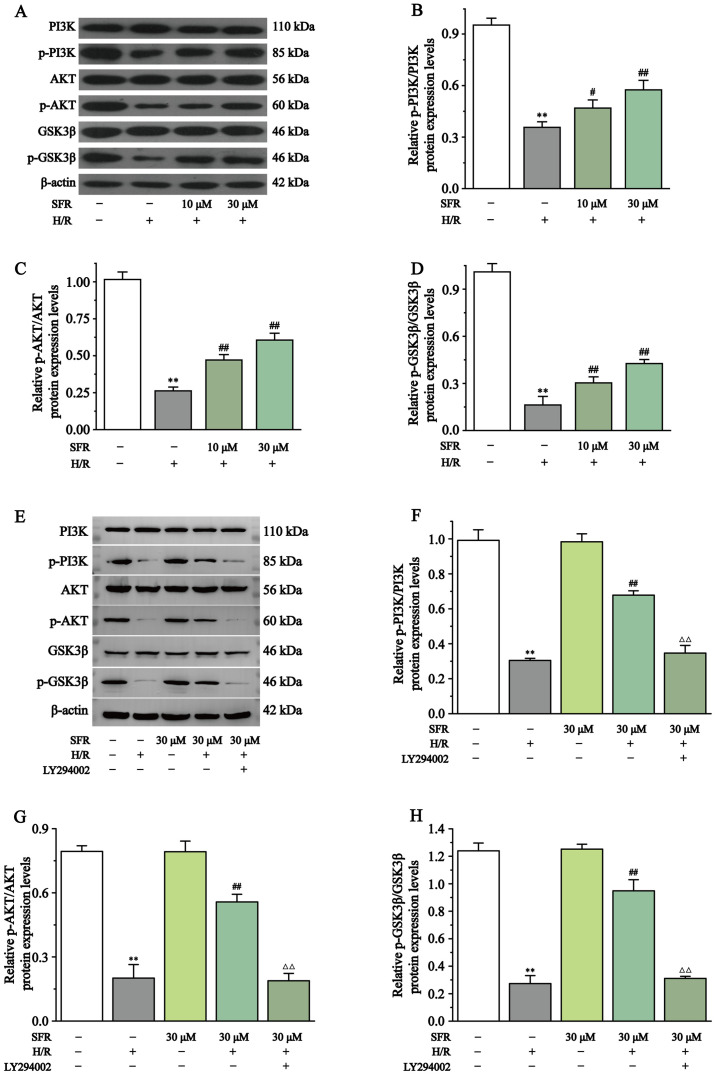
Figure 9.
Effect of SFR on the PI3K/AKT/GSK3β signaling pathway protein expression levels. (A) Western blot analysis of the PI3K, p-PI3K, AKT, p-AKT, GSK3β and p-GSK3β expression levels in CONT, H/R, SFRL + H/R and SFRH + H/R groups. The ratio of (B) p-PI3K to PI3K, (C) p-AKT to AKT and (D) p-GSK3β to GSK3β normalized to β-actin. (E) Western blot analysis of the PI3K, p-PI3K, AKT, p-AKT, GSK3β and p-GSK3β expression levels in CONT, H/R, SFRH + H/R, SFRA and LY294002 + SFRH + H/R groups. The ratio of (F) p-PI3K to PI3K, (G) p-AKT to AKT and (H) p-GSK3β to GSK3β normalized to β-actin. Data are presented as the mean ± SEM. n=3. **P<0.01 vs. CONT; #P<0.05, ## P<0.01 vs. H/R; and ΔΔP<0.01 vs. SFRH + H/R. SFRL, low dose SFR; SFRH, high dose SFR; SFRA, SFR alone. SFR, safranal; CONT, control; H/R, hypoxia/reoxygenation; p, phosphorylated.

