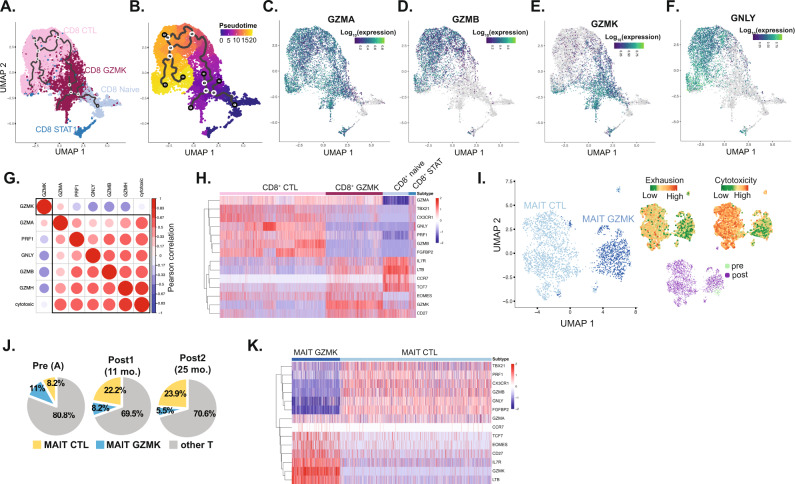
Fig. 4. Trajectory analysis of CD8+ T cells.
A, B Monocle3-based pseudotemporal analysis of CD8+ subsets. C–F Expression of GZMA, GZMB, GZMK and GNLY in cells projected onto the trajectory of CD8+ continuum. G Pearson correlation between GZMK and other cytotoxic genes in CD8+ cells. H Heatmap of differentially expressed genes among CD8+ T lymphocyte subsets. I UMAP of MAIT cells with exhaustion and cytotoxicity scores projection. J Distribution of T-cell subsets in PT1. K Heatmap of differentially expressed genes between MAIT subsets.

