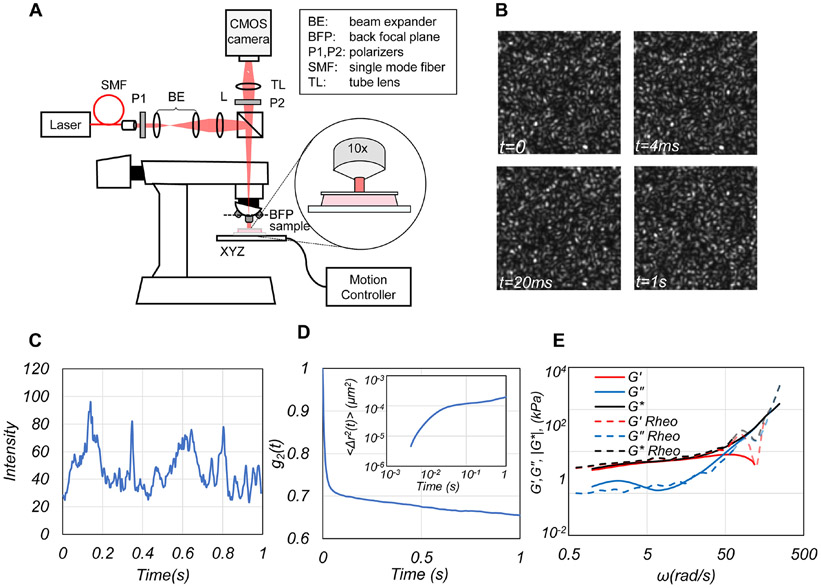
Figure 1. SHEAR platform.
(A) Schematic of the SHEAR optical set up. (B) Representative speckle frames acquired at 4 time points. (C) A representative trace of temporal speckle intensity fluctuations from a normal adipose breast tissue. (D) Cross-correlation of speckle fluctuations provides the speckle intensity autocorrelation, g2(t), from which the mean square displacement (MSD) of particles is deduced (inset). (E) Substituting the MSD in the GSER returns ∣G*(ω)∣, G'(ω) and G"(ω) (Supplementary Method 1).

