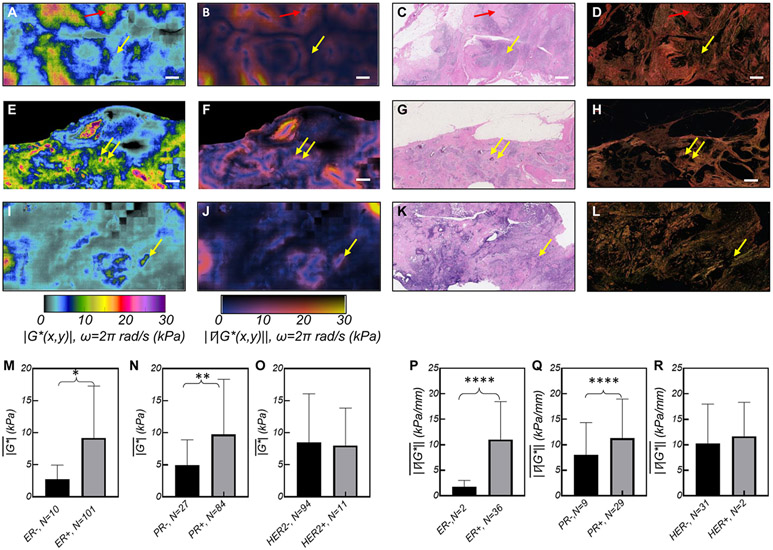
Figure 6. SHEAR ∣G*(x,y)∣ maps of breast tumors with different molecular receptors.
(A) ∣G*(x,y)∣ map of a Grade 3, ER/PR+, HER2−, ILC. The corresponding (B) ∣∇∣G*(x,y)∥; (C) H&E, and (D) PSR sections. The H&E image reveals adipocytes, tumor cells, and degenerated collagen fibers in softer regions of ~5 kPa (yellow arrow) and pauci-cellular fibrous ECM in stiffer areas of ~10kPa (red arrow). (E) ∣G*(x,y)∣ map of a Grade 3, ER/PR/HER2+ IDC tumor with DCIS components. The map has a background of ∣G*(x,y)∣< 5kPa, islands of ∣G*(x,y)∣ < 10 kPa, and sporadic spots of ∣G*(x,y)∣> 30 kPa (yellow arrows); (F) The corresponding ∣∇∣G*(x,y)∥ shows excellent sensitivity in detecting the stromal interface. (G) The H&E image reveals necrotic calcifications at stiff spots (yellow arrows) that are not visible in (H) the PSR image. (I) ∣G*(x,y)∣ map of a Grade 3, IDC, ER/PR/HER2− showing mostly compliant area of <5 kPa, with occasional islands of increased ∣G*(x,y)∣ ~ 5 – 10 (J) ∣∇∣G*(x,y)∥ shows an overall low gradient. (K) H&E image presents high grade tumor cells, inflammatory lymphocytes and histiocytes, and necrosis. (L) The PSR image features collagen fibrils laced around tumor cells. (Scale bars: 1 mm). Bar diagrams, comparing in tumors with: (M) ER− and ER+; (N). PR− and PR+; (O) HER2− and HER2+. Bar diagrams comparing in tumors with: (P) ER− and ER+; (Q). PR− and PR+; (R) HER2− and HER2+. The stars indicate the significance level of the un-paired t-test, used to compare the groups. (p<0.05: *,p<0.01: **,p<0.001: ***,p<0.0001: ****). All ∣G*(x,y)∣ and ∣∇∣G*(x,y)∥ maps and bar plots are computed at ω=2π rad/s (f=1Hz).

