Fig. 5.
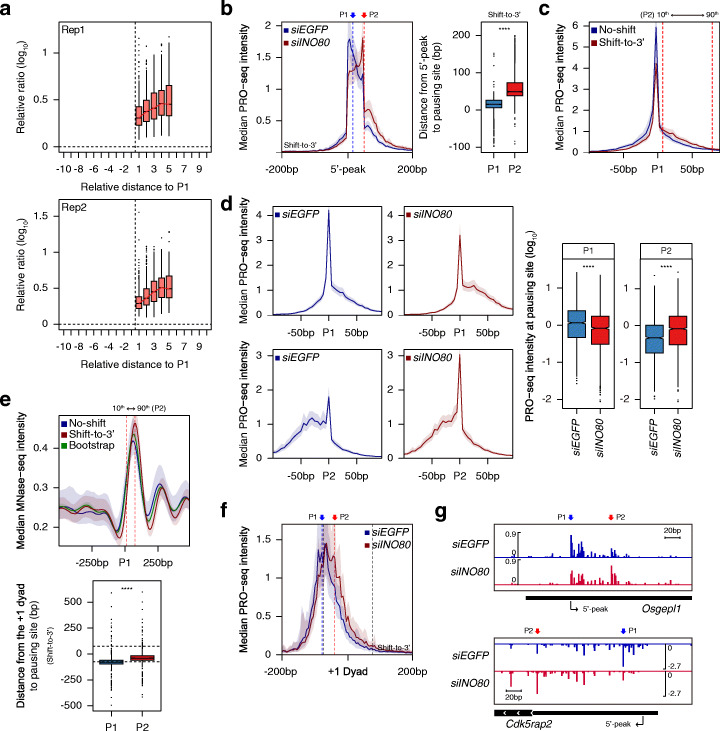
INO80 mediates RNAPII pausing site determination in mESCs. a Boxplots represent the relative read ratio (log10) at the significantly increasing peaks (the ratio of siINO80 versus siEGFP) in a manner similar to Fig. 3b (2406 peaks for replicate 1 and 2408 peaks for replicate 2 out of 2962 peaks at 1890 genes). b Average profile displays median PRO-seq intensity in mESCs treated with siEGFP or siINO80 for shift-to-3′ genes (left). Boxplot shows the distance from 5′-peak to the indicated pausing sites (right). c Average profiles exhibit median PRO-seq intensity in siEGFP-treated mESCs at no-shift and shift-to-3′ genes. d Average profiles depict median PRO-seq intensity (left), and boxplots represent the smoothed PRO-seq intensity (right) at the indicated pausing sites for shift-to-3′ genes. e Average profile shows median MNase-seq intensity obtained from untreated mESCs (GSM2906312 and GSM2906313) around P1 of no-shift and shift-to-3′ genes (top). The green line indicates the median of 1000 bootstrap samples (Each sample containing the same number of genes to the original population and was obtained by resampling allowing replacement). Boxplot exhibits the distance from the + 1 dyad to the indicated pausing sites for shift-to-3′ genes (bottom). For (c) and (e), the two dotted lines represent the 10th (12.9 bp) and 90th (76.1 bp) percentiles of P2 relative to P1. f Average profile displays median PRO-seq intensity around the + 1 dyad for shift-to-3′ genes. For (e) and (f), only genes with nucleosomes overlapped with H3K4me3 ChIP-seq enrichment (GSM590111) were used in an effort to exclude false-positive nucleosomes (431 no-shift genes and 500 shift-to-5′ genes upon INO80-KD). g Genome browser view of PRO-seq signal for representative shift-to-3′ genes. All PRO-seq data were generated using combined biological replicates. For average profiles, medians reflect the 5-bp bin (PRO-seq) or the 10-bp bin (MNase-seq). Asterisks represent statistically significant differences based on Mann-Whitney U test

