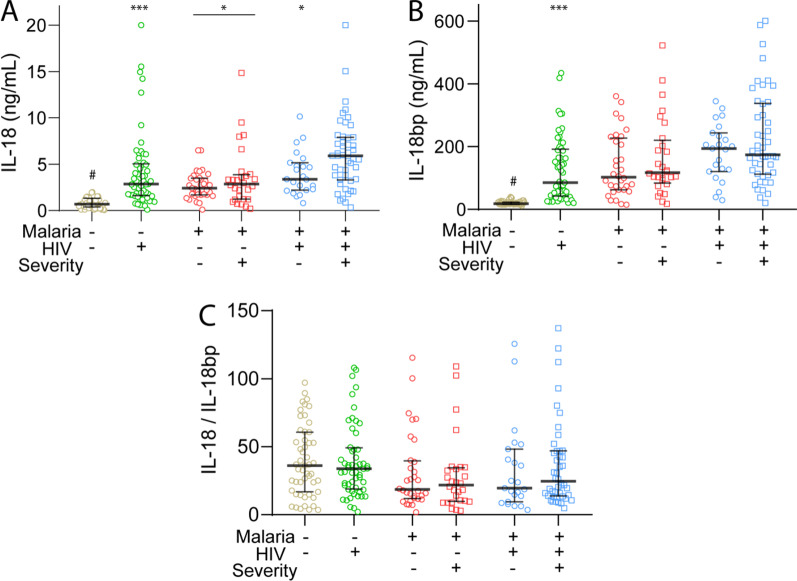
Fig. 1.
Plasma levels of IL-18 (A), IL-18bp (B) and the C IL-18/IL-18bp ratio according to severity. IL-18 and IL-18bp were measured in plasma in patients with HIV infection with febrile symptoms but without malaria (n = 58), patients with falciparum malaria without (M, n = 61 of which 28 with severe disease) and with HIV infection (HIV + M, n = 70 of which 47 with severe disease). For comparison, data from healthy controls (CTR, n = 52) are also included. Lines in the scatter plot represent the median and 25–75th percentiles. #p < 0.001 vs. all patient groups; *p < 0.05, ***p < 0.001 versus HIV + M with severe malaria. In A the line with * indicates the Malaria without HIV group as a whole

