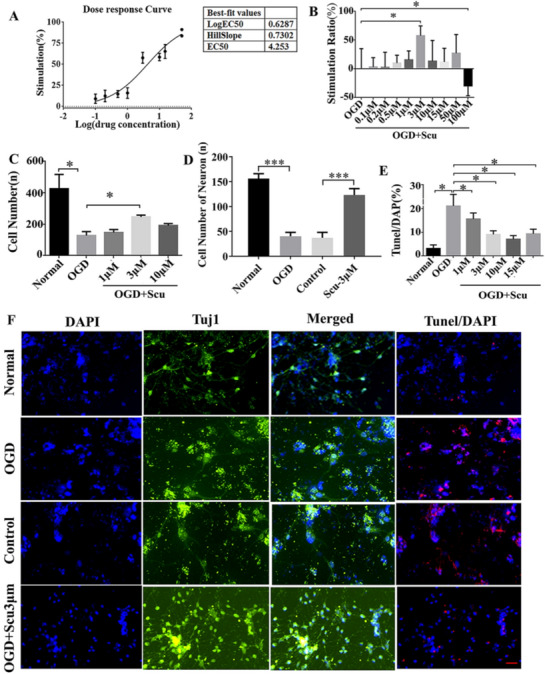
Fig. 1.

Effects of Scu administration on primary cortical neurons post OGD. a The dose response curve showed the significant variation from log (EC50) (− 2) to log (EC50) 2. b, c Stimulation ratio comparison among the Scu groups of different concentrations, normal group, and OGD group. There was a statistically significant difference in Scu 3 μM group and Scu 10 μM group compared with the normal group and OGD group. d Cell number among the normal, OGD, Scu 1 μM, Scu 3 μM and Scu 10 μM groups. e TUNEL/DAPI results showed cell apoptosis in the normal, OGD, OGD + Scu 1 μM, OGD + Scu 3 μM, OGD + Scu 10 μM and OGD + Scu 15 μM groups. f Immunofluorescence staining results of Tuj1 in the normal, OGD, Control and OGD + Scu 3 μM groups. Normal only cell culture group, OGD Oxygen–glucose deprivation, Control OGD + DMSO group, Scu Scutellarin, TUNEL Terminal-deoxynucleoitidyl Transferase Mediated Nick End Labeling, DAPI 4ʹ,6-diamidino-2-phenylindole, a fluorescent dye used in nucleic acid stain. *p < 0.05, scale bar = 50 μm, n = 3/group
