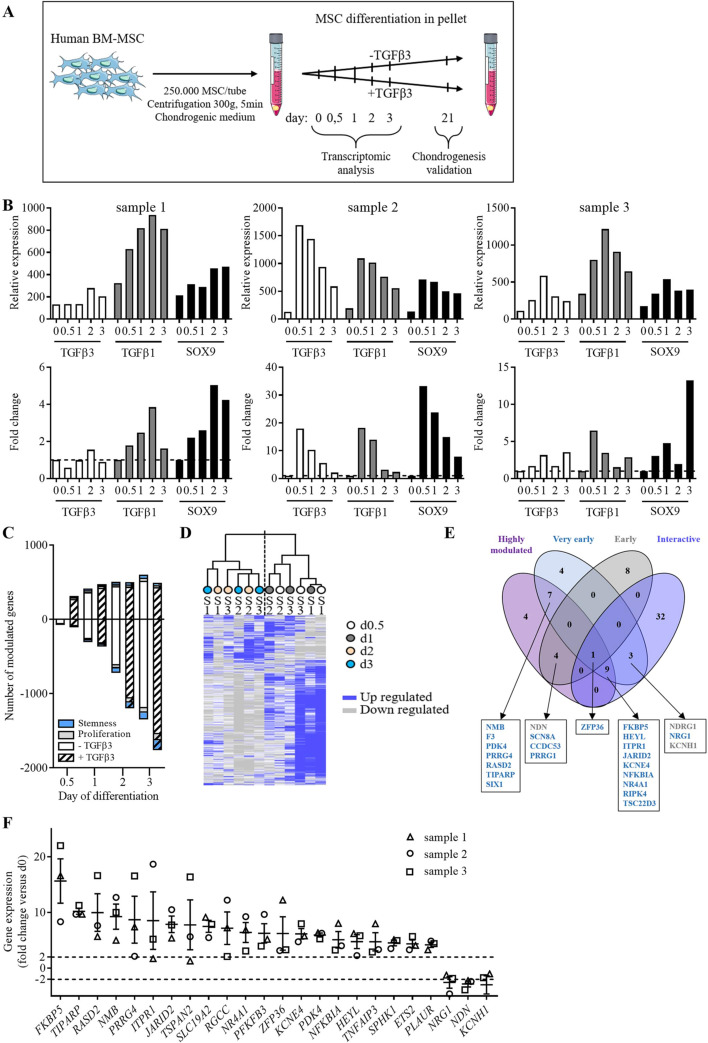
Fig. 1.
Microarray analysis and gene selection. A Experimental work flow. Bone-marrow MSCs (BM-MSC) were induced to differentiate into chondrocytes using the pellet culture conditions with or without TGFβ3. Pellets were recovered at different time points (day 0, 0.5, 1, 2 and 3) for transcriptomic analysis and at d21, for validating chondrogenic differentiation. B Fold change expression of 3 selected genes in the 3 samples used in microarrays as determined by the transcriptomic analysis (upper panel) or by real-time qPCR (bottom panel). C Number of significantly up-regulated (positive values) and down-regulated (negative values) genes at different time points as compared to d0, in samples differentiated without (blank bar) or with TGFβ3 (hatched bar). The number of genes relative to proliferation or stemness signature are in grey and blue, respectively. D Unsupervised hierarchical clustering. Gene expression for the 3 BM-MSC samples (S1-3) cultured in TGFβ3 condition, at different time points (d0.5, 1, 2, 3) using the 17,000 probe sets. Up regulated and down regulated genes are in blue and grey colors, respectively. E Venn diagram including the top 25 up- and down-regulated genes independently of the time points (called “most regulated”, in purple), the genes significantly regulated at d0.5 and d1 (called “very early genes”, in blue), the genes significantly regulated at d0.5 and d1 (called “early genes”, in grey) and the genes significantly regulated at the 4 time points and interacting within the same pathway as determined by IPA analysis (called “interactive”, in dark purple). Up- and down-regulated selected genes are in blue and grey, respectively. F Relative expression of the genes selected in (E) as determined by the transcriptomic analysis

