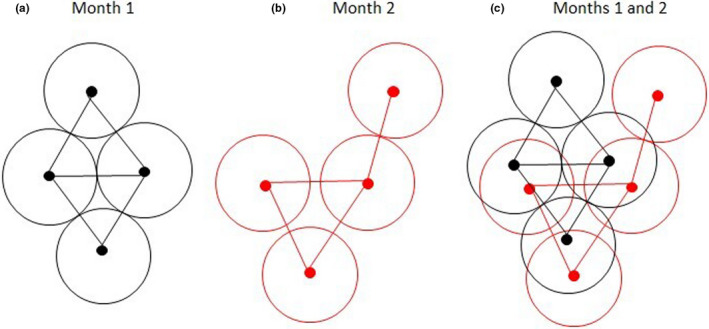
FIGURE 2.

Diagram showing the method used to select incidental koala sightings to estimate koala population density. Circles represent an average home range area for a koala. Black and red dots represent locations of koala sightings for month 1 and month 2, respectively. The black and red lines show the closest distance between two koala sighting locations. (a) shows a selection of koala sighting locations for month 1, while (b) shows a selection of koala sightings for month 2. (c) shows the two monthly datasets combined. Using this approach, monthly sightings for each year over the 17‐year study period were compiled and used to estimate koala sighting density
