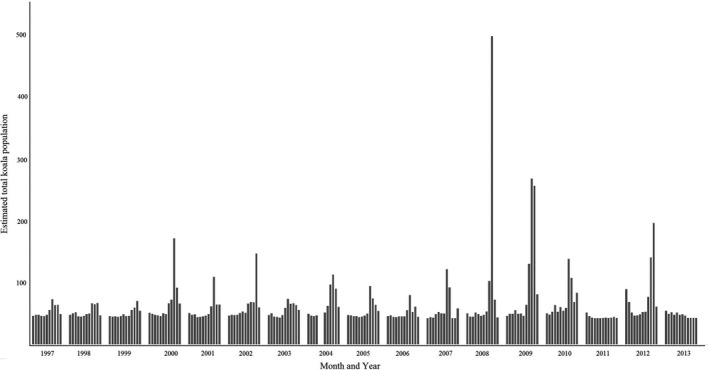
FIGURE 4.

Bar graph showing the estimated total number of koalas in the South‐East Queensland study area estimated from the spatio‐temporal point process model as a function of calendar month and year. The spatio‐temporal point process model has been informed by monthly observed koala sightings ( = 6,580) recorded in South‐East Queensland, 1997–2013
