FIGURE 3.

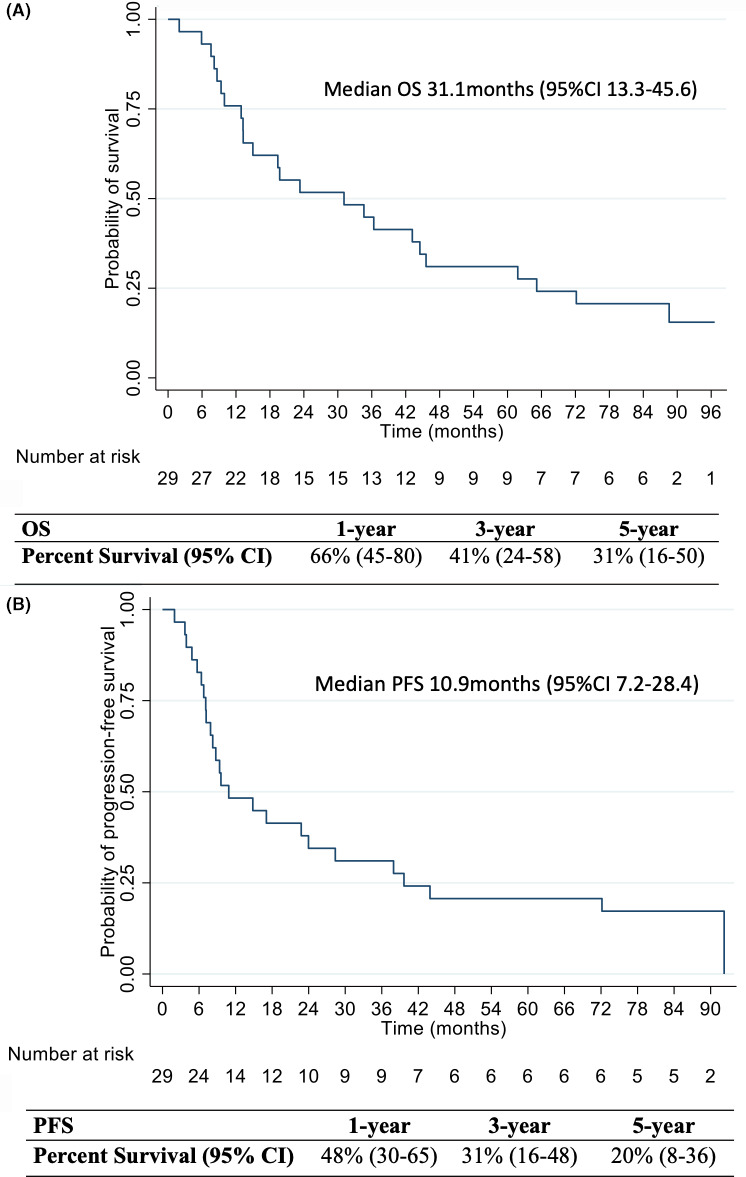
Overall survival (A) and progression‐free survival (B) with the corresponding 1‐, 3‐, and 5‐year percent OS and PFS rates

Overall survival (A) and progression‐free survival (B) with the corresponding 1‐, 3‐, and 5‐year percent OS and PFS rates