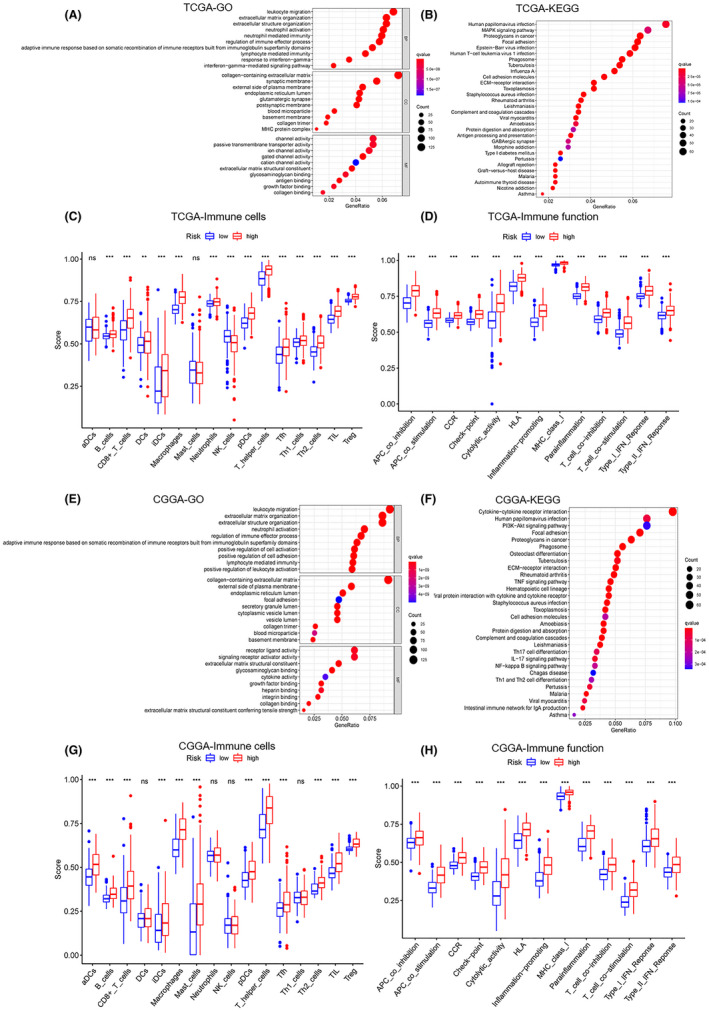
FIGURE 6.

Pathway analysis showed a high association between RBPs and tumor microenvironment immune function (A) GO analysis of differentially expressed genes between high‐risk and low‐risk groups in the TCGA dataset. (B) KEGG analysis of differentially expressed genes between high‐risk and low‐risk groups in TCGA dataset. (C) Boxplot of comparison of immune cells between high‐risk and low‐risk groups in TCGA dataset. (D) Boxplot of comparison of the immune system between high‐risk and low‐risk groups in TCGA dataset. (E) GO analysis of differentially expressed genes between high‐risk and low‐risk groups in the CGGA dataset. (F) KEGG analysis of differentially expressed genes between high‐risk and low‐risk groups in CGGA dataset. (G) Boxplot of comparison of immune cells between high‐risk and low‐risk groups in CGGA dataset. (H) Boxplot of comparison of the immune system between high‐risk and low‐risk groups in CGGA dataset. Kruskal–Wallis H‐test was used to compare the the difference between groups. ns: p > 0.05, *p < 0.05, **p < 0.01, ***p < 0.001
