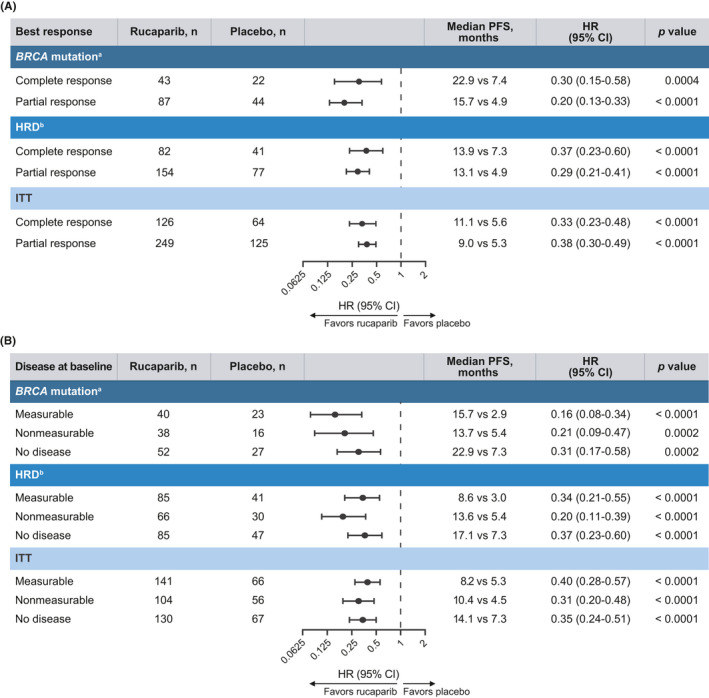
FIGURE 1.

Investigator‐assessed PFS analyses in subgroups. Subgroups defined by (A) best response to last platinum‐based chemotherapy regimen and (B) disease at baseline. p values are presented for descriptive purposes only. aGermline, somatic or unknown; b BRCA mutation + wild‐type BRCA/high loss of heterozygosity. CI indicates confidence interval; HR, hazard ratio; HRD, homologous recombination deficient; ITT, intent to treat; PFS, progression‐free survival
