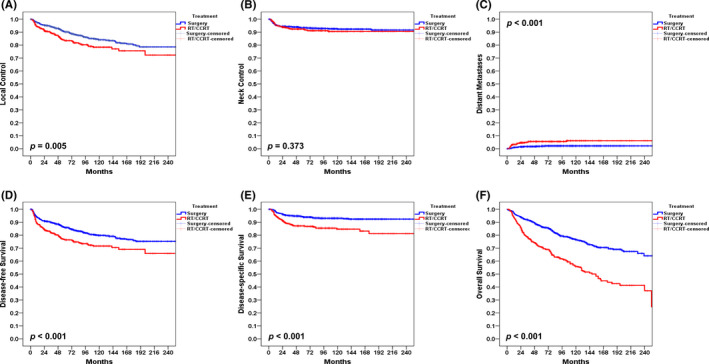
FIGURE 3.

Kaplan–Meier plots of 5‐year local control (A), neck control (B), distant metastases (C), disease‐free survival (D), disease‐specific survival (E), and overall survival (F) for patients with pN0 disease treated with surgery alone and surgery plus adjuvant therapy
