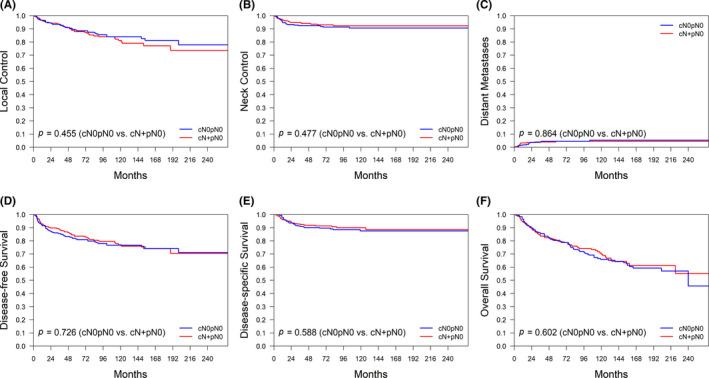
FIGURE 5.

Kaplan–Meier plots of 5‐year local control (A), neck control (B), distant metastases (C), disease‐free survival (D), disease‐specific survival (E), and overall survival (F) for patients with cN0pN0, cN+pN0, cN0pN+, and cN+pN+ disease in the propensity score‐matched cohort
