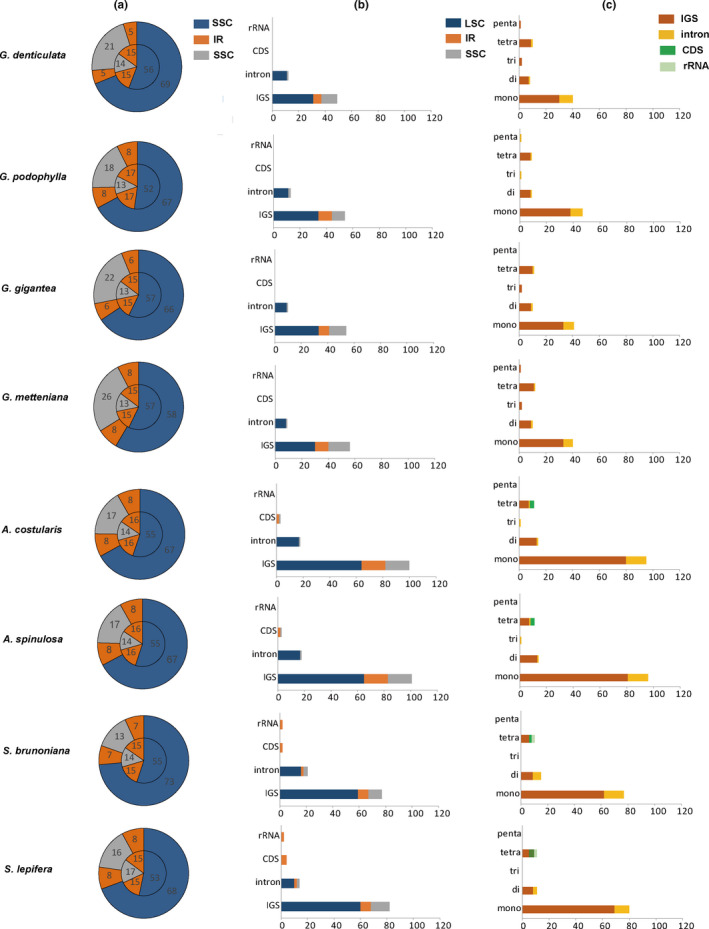
FIGURE 2.

Comparison of microsatellite repeats among the eight Cyatheaceae chloroplast genomes. (a) The inner circle is the distribution ratio of the four regions (LSC, SSC, and IRs) in the genome, and the outer circle is the distribution ratio of SSRs between the four regions. (b) Distribution ratio of SSRs in different regions (LSC, SSC, and IRs) of chloroplast genome. (c) Ratio of mono‐ to pentanucleotide SSRs in different regions (IGS, intron, CDS, and rRNA gene) of the chloroplast genome. Numbers represent the distribution ratio of SSR numbers. LSC: large single copy region; SSC: small single copy region; IR: inverted repeat region; IGS: intergenic spacer region; CDS: coding sequence region
