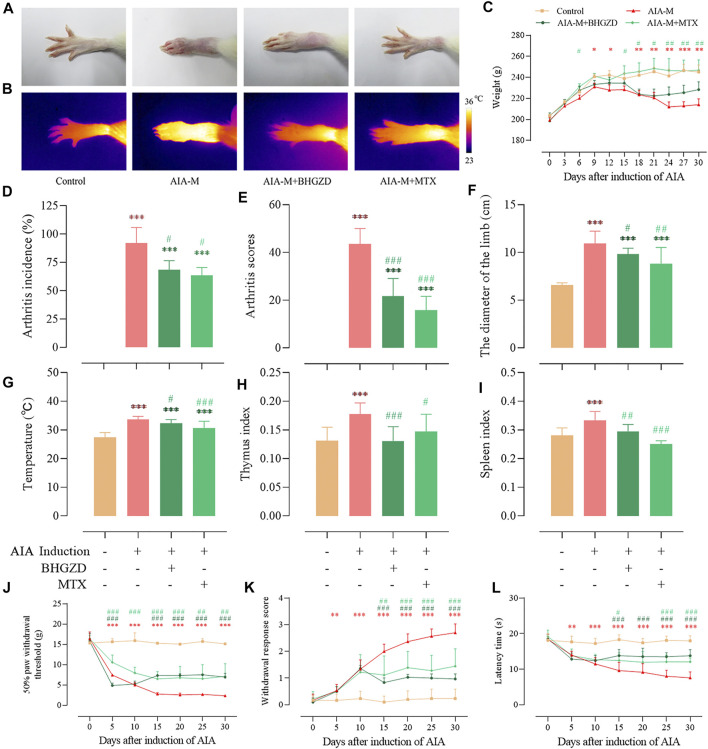
FIGURE 1.
Effects of BHGZD on the severity of arthritis in AIA-M rats of different groups. (A) Macroscopic performances of arthritis; (B) infrared thermography; (C) weight; (D) arthritis incidence; (E) arthritis scores; (F) the diameter of the limb; (G) articular temperature; (H) the thymus index; (I) the spleen index; (J) mechanically induced hyperalgesia; (K) acetone-induced hyperalgesia; (L) thermally induced hyperalgesia. Data are expressed as the mean ± S.D. *, **, and ***, p < 0.05, p < 0.01, and p < 0.001, respectively, in comparison with the normal control group; #, ##, and ###, p < 0.05, p < 0.01, and p < 0.001, respectively, in comparison with the AIA-M group.

