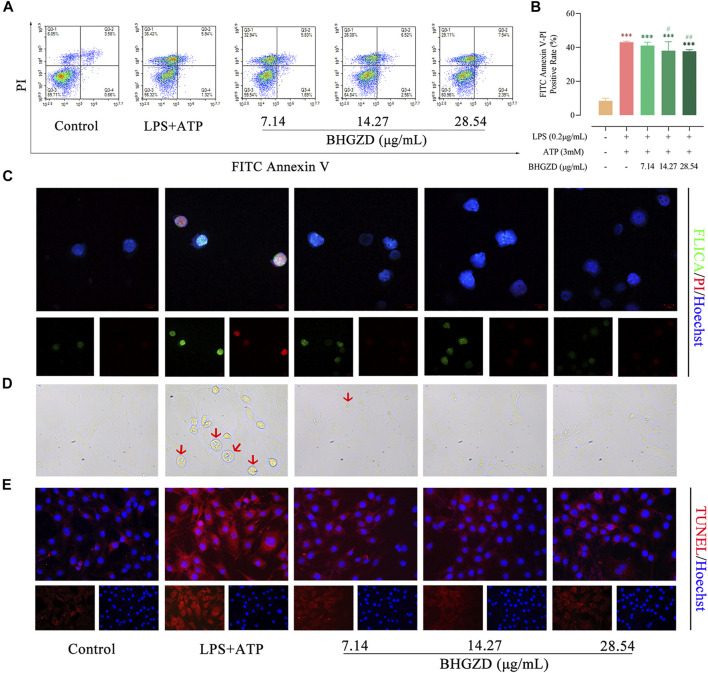
FIGURE 3.
BHGZD inhibits LPS/ATP–induced pyroptosis in both Raw264.7 macrophage and MH7A cells. (A ∼ B) Flow cytometry analysis for Annexin V/PI staining in Raw264.7 macrophage cells. (C) Representative images of FLICA caspase-1 that binds only to activated caspase-1 (scale bar represents 10 μm; FAM-FLICA green, PI red, Hoechst blue). (D) Representative phase-contrast images of MH7A cells (scale bar represents 50 μm). Arrows indicate cells undergoing pyroptosis (swollen cells). (E) TUNEL staining of MH7A cells (scale bar represents 50 μm; TUNEL red, Hoechst blue). ***, p < 0.001, in comparison with the normal control group; # and ##, p < 0.05 and p < 0.01, respectively, in comparison with the LPS/ATP–induced model.

